


How do you use a graphing calculator to find the limit of the sequence \[{a_n} = {\left( {\dfrac{1}{2}} \right)^n}\] ?
Answer
561.9k+ views
Hint: Here the given question based on geometric series. We have to plot a graph of the given function of the series. Firstly, we have to make a sequence of series by giving a n values, where n belongs to integers i.e., \[n \in I\] . After that plot a graph by taking n values in x-axis and \[{a_n}\] values in y-axis.
Complete step by step solution:
A geometric series is also termed as the geometric progression. It is a series formed by multiplying the first term by a fixed value to get the second term. This process is continued until we get a required number of terms in the series. Such a progression increases in a specific way and hence giving a geometric progression.
Consider, the given limit of the sequence:
\[ \Rightarrow {a_n} = {\left( {\dfrac{1}{2}} \right)^n}\] where \[n \in I\] .
Now giving the n values … -3, -2, -1, 0, 1, 2, 3, … to the above equation simultaneously we get the values of \[{a_n}\] .
Now put \[n = - 3\] , then
\[ \Rightarrow {a_{ - 3}} = {\left( {\dfrac{1}{2}} \right)^{ - 3}}\]
\[ \Rightarrow {a_{ - 3}} = \dfrac{1}{{{2^{ - 3}}}}\]
\[ \Rightarrow {a_{ - 3}} = {2^3} = 8\]
Put \[n = - 2\] , then
\[ \Rightarrow {a_{ - 2}} = {\left( {\dfrac{1}{2}} \right)^{ - 2}}\]
\[ \Rightarrow {a_{ - 2}} = {2^2} = 4\]
Put \[n = - 1\] , then
\[ \Rightarrow {a_{ - 1}} = {\left( {\dfrac{1}{2}} \right)^{ - 1}}\]
\[ \Rightarrow {a_{ - 1}} = {2^1} = 2\]
Put \[n = 0\] , then
\[ \Rightarrow {a_0} = {\left( {\dfrac{1}{2}} \right)^0}\]
\[ \Rightarrow {a_0} = 1\]
Put \[n = 1\] , then
\[ \Rightarrow {a_1} = {\left( {\dfrac{1}{2}} \right)^1}\]
\[ \Rightarrow {a_1} = 0.5\]
Put \[n = 2\] , then
\[ \Rightarrow {a_2} = {\left( {\dfrac{1}{2}} \right)^2}\]
\[ \Rightarrow {a_2} = \dfrac{1}{{{2^2}}} = \dfrac{1}{4}\]
\[ \Rightarrow {a_2} = 0.25\]
Put \[n = 3\] , then
\[ \Rightarrow {a_3} = {\left( {\dfrac{1}{2}} \right)^3}\]
\[ \Rightarrow {a_3} = \dfrac{1}{{{2^3}}} = \dfrac{1}{8}\]
\[ \Rightarrow {a_3} = 0.125\]
And so on…
Hence the sequence \[{a_n}\] as written as:
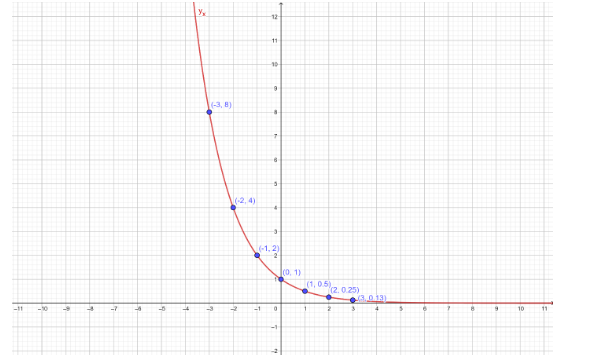
\[ \Rightarrow {a_n} = \cdot \cdot \cdot ,8,4,2,1,0.5,0.25,0.125, \cdot \cdot \cdot \]
Now, we can plot the graph of \[{a_n} = {\left( {\dfrac{1}{2}} \right)^n}\] , by taking n values in x-axis and \[{a_n}\] values in y-axis.
Note: The question is belonging to the concept of graph. To plot a graph first we have to choose which one is x-axis and y-axis. Or by choosing the value of x we can determine the value of y and then plotting the graphs for these points we obtain the result.
Complete step by step solution:
A geometric series is also termed as the geometric progression. It is a series formed by multiplying the first term by a fixed value to get the second term. This process is continued until we get a required number of terms in the series. Such a progression increases in a specific way and hence giving a geometric progression.
Consider, the given limit of the sequence:
\[ \Rightarrow {a_n} = {\left( {\dfrac{1}{2}} \right)^n}\] where \[n \in I\] .
Now giving the n values … -3, -2, -1, 0, 1, 2, 3, … to the above equation simultaneously we get the values of \[{a_n}\] .
Now put \[n = - 3\] , then
\[ \Rightarrow {a_{ - 3}} = {\left( {\dfrac{1}{2}} \right)^{ - 3}}\]
\[ \Rightarrow {a_{ - 3}} = \dfrac{1}{{{2^{ - 3}}}}\]
\[ \Rightarrow {a_{ - 3}} = {2^3} = 8\]
Put \[n = - 2\] , then
\[ \Rightarrow {a_{ - 2}} = {\left( {\dfrac{1}{2}} \right)^{ - 2}}\]
\[ \Rightarrow {a_{ - 2}} = {2^2} = 4\]
Put \[n = - 1\] , then
\[ \Rightarrow {a_{ - 1}} = {\left( {\dfrac{1}{2}} \right)^{ - 1}}\]
\[ \Rightarrow {a_{ - 1}} = {2^1} = 2\]
Put \[n = 0\] , then
\[ \Rightarrow {a_0} = {\left( {\dfrac{1}{2}} \right)^0}\]
\[ \Rightarrow {a_0} = 1\]
Put \[n = 1\] , then
\[ \Rightarrow {a_1} = {\left( {\dfrac{1}{2}} \right)^1}\]
\[ \Rightarrow {a_1} = 0.5\]
Put \[n = 2\] , then
\[ \Rightarrow {a_2} = {\left( {\dfrac{1}{2}} \right)^2}\]
\[ \Rightarrow {a_2} = \dfrac{1}{{{2^2}}} = \dfrac{1}{4}\]
\[ \Rightarrow {a_2} = 0.25\]
Put \[n = 3\] , then
\[ \Rightarrow {a_3} = {\left( {\dfrac{1}{2}} \right)^3}\]
\[ \Rightarrow {a_3} = \dfrac{1}{{{2^3}}} = \dfrac{1}{8}\]
\[ \Rightarrow {a_3} = 0.125\]
And so on…
Hence the sequence \[{a_n}\] as written as:
\[ \Rightarrow {a_n} = \cdot \cdot \cdot ,8,4,2,1,0.5,0.25,0.125, \cdot \cdot \cdot \]
Now, we can plot the graph of \[{a_n} = {\left( {\dfrac{1}{2}} \right)^n}\] , by taking n values in x-axis and \[{a_n}\] values in y-axis.
Note: The question is belonging to the concept of graph. To plot a graph first we have to choose which one is x-axis and y-axis. Or by choosing the value of x we can determine the value of y and then plotting the graphs for these points we obtain the result.
Recently Updated Pages
Master Class 12 Business Studies: Engaging Questions & Answers for Success
Master Class 12 Chemistry: Engaging Questions & Answers for Success
Master Class 12 Biology: Engaging Questions & Answers for Success
Class 12 Question and Answer - Your Ultimate Solutions Guide
Master Class 11 Social Science: Engaging Questions & Answers for Success
Master Class 11 Chemistry: Engaging Questions & Answers for Success
Trending doubts
Which are the Top 10 Largest Countries of the World?
Draw a labelled sketch of the human eye class 12 physics CBSE
Name the crygenes that control cotton bollworm and class 12 biology CBSE
Differentiate between homogeneous and heterogeneous class 12 chemistry CBSE
Ribosomal RNA is actively synthesised in A Nucleoplasm class 12 biology CBSE
How many molecules of ATP and NADPH are required information class 12 biology CBSE