


The value of \[\sin \theta \] increases as \[\theta \] increases in interval \[\left( 0,\dfrac{\pi }{2} \right)\] . Enter \[1\] for true and \[0\] for false.
Answer
581.7k+ views
Hint: Problems like these are quite easy to solve once we understand the underlying concepts behind the sum. For such questions we need to have a fair idea of the graph of the given function as well as we need to know about differential calculus and continuity to some extent. With the help of calculus we can easily figure out the nature of the graph of the function. From the graph of the function we can easily say that if the curve inclines upwards, then it means that the value of the function increases and if the curve declines downwards, then the function decreases.
Complete step-by-step solution:
Now we start off with the solution to the above given problem by plotting the graph of the given function.
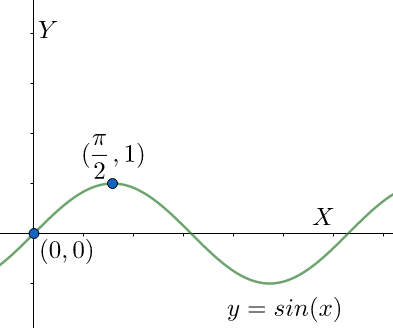
From the graph we can clearly notice that the curve is increasing in nature, which means, with an increase in the value of ‘x’ the corresponding functional value also increases. Here the ‘x’ axis represent the values of the angle \[\theta \] and we can clearly say that with an increase in the value of \[\theta \] within the interval \[\left( 0,\dfrac{\pi }{2} \right)\] , the value of the function also increases.
Note: Apart from solving this particular problem using graphs we can also solve it by putting the respective values of the function. We can easily put some values which lie within the given interval and then predict the nature of the given function from the functional values. However the method of plotting graphs is a much easier and trusted method and is in general the most recommended method. We need to have a clear cut idea of differential calculus and graphs to be able to plot the given graph of the function efficiently.
Complete step-by-step solution:
Now we start off with the solution to the above given problem by plotting the graph of the given function.
From the graph we can clearly notice that the curve is increasing in nature, which means, with an increase in the value of ‘x’ the corresponding functional value also increases. Here the ‘x’ axis represent the values of the angle \[\theta \] and we can clearly say that with an increase in the value of \[\theta \] within the interval \[\left( 0,\dfrac{\pi }{2} \right)\] , the value of the function also increases.
Note: Apart from solving this particular problem using graphs we can also solve it by putting the respective values of the function. We can easily put some values which lie within the given interval and then predict the nature of the given function from the functional values. However the method of plotting graphs is a much easier and trusted method and is in general the most recommended method. We need to have a clear cut idea of differential calculus and graphs to be able to plot the given graph of the function efficiently.
Recently Updated Pages
Master Class 11 English: Engaging Questions & Answers for Success
Master Class 11 Physics: Engaging Questions & Answers for Success
Master Class 11 Computer Science: Engaging Questions & Answers for Success
Master Class 11 Chemistry: Engaging Questions & Answers for Success
Master Class 11 Social Science: Engaging Questions & Answers for Success
Master Class 11 Accountancy: Engaging Questions & Answers for Success
Trending doubts
Difference Between Prokaryotic Cells and Eukaryotic Cells
Two of the body parts which do not appear in MRI are class 11 biology CBSE
One Metric ton is equal to kg A 10000 B 1000 C 100 class 11 physics CBSE
10 examples of friction in our daily life
Draw a diagram of nephron and explain its structur class 11 biology CBSE
Draw a diagram of a plant cell and label at least eight class 11 biology CBSE