


The taxi fare in a city is as follows: Rs.20 for each ride and Rs.7 for each km. Taking distance covered as x km and total fare as Rs. y, write a linear equation for this information and draw its graph. Read from the graph the fare paid for traveling 5 km.
Answer
611.7k+ views
Hint: Given that Rs.20 is taken extra for each ride irrespective of the kilometres travelled. So after considering distance covered as x km and the fare for this distance as Rs. y, we get a linear equation $ y = 7x + 20 $ because for each kilometre we have to pay Rs.7. Consider x as some values like, 1, 2, 3 ad we will get the corresponding y values. Using these points draw a graph and find the fare paid for travelling 5km.
Complete step-by-step answer:
We are given that the taxi charges Rs. 20 for each ride and Rs. 7 for each km in a city.
We have to write a linear equation taking distance covered as x km and fare paid as Rs. y and draw its graph. From this graph, we have to get the fare paid for travelling 5 km.
For each km, the fare paid is Rs. 7.
Therefore for x km, the fare paid will be $ 7x $
Then for each ride travelling x km the total fare will be y.
$ y = 7x + 20 $ , because Rs. 20 is extra for each ride irrespective of the no. of kilometres travelled
Here when x is 1 km, y is
$ \Rightarrow 7\left( 1 \right) + 20 = Rs.27 $
When x is 2 km, y is
$ \Rightarrow 7\left( 2 \right) + 20 = Rs.34 $
When x is 3 km, y is
$ \Rightarrow 7\left( 3 \right) + 20 = Rs.41 $
So to plot the graph of the linear equation $ y = 7x + 20 $ we have the points $ \left( {1,27} \right),\left( {2,34} \right),\left( {3,41} \right) $
Plot these points on a graph to give the graph of the line $ y = 7x + 20 $
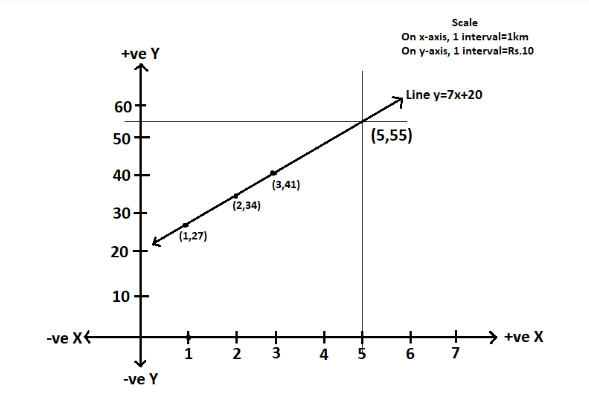
As we can see in the above graph, when x is 5 km y is Rs.55.
So the fare paid for travelling 5 km is Rs. 55.
So, the correct answer is “55”.
Note: When you are supposed to draw a graph on real entities like kilometres, rupees, fruits, persons etc., do not forget to write the scale. Because, the axes of a graph must inform what they are depicting. Here the x-axis we have taken as km and the y-axis we have taken as rupees. So we have written the scale accordingly. To verify the obtained fare is correct or not, we can just substitute the value of x as 5 in the equation and find the corresponding y.
Complete step-by-step answer:
We are given that the taxi charges Rs. 20 for each ride and Rs. 7 for each km in a city.
We have to write a linear equation taking distance covered as x km and fare paid as Rs. y and draw its graph. From this graph, we have to get the fare paid for travelling 5 km.
For each km, the fare paid is Rs. 7.
Therefore for x km, the fare paid will be $ 7x $
Then for each ride travelling x km the total fare will be y.
$ y = 7x + 20 $ , because Rs. 20 is extra for each ride irrespective of the no. of kilometres travelled
Here when x is 1 km, y is
$ \Rightarrow 7\left( 1 \right) + 20 = Rs.27 $
When x is 2 km, y is
$ \Rightarrow 7\left( 2 \right) + 20 = Rs.34 $
When x is 3 km, y is
$ \Rightarrow 7\left( 3 \right) + 20 = Rs.41 $
So to plot the graph of the linear equation $ y = 7x + 20 $ we have the points $ \left( {1,27} \right),\left( {2,34} \right),\left( {3,41} \right) $
Plot these points on a graph to give the graph of the line $ y = 7x + 20 $
As we can see in the above graph, when x is 5 km y is Rs.55.
So the fare paid for travelling 5 km is Rs. 55.
So, the correct answer is “55”.
Note: When you are supposed to draw a graph on real entities like kilometres, rupees, fruits, persons etc., do not forget to write the scale. Because, the axes of a graph must inform what they are depicting. Here the x-axis we have taken as km and the y-axis we have taken as rupees. So we have written the scale accordingly. To verify the obtained fare is correct or not, we can just substitute the value of x as 5 in the equation and find the corresponding y.
Recently Updated Pages
Master Class 8 English: Engaging Questions & Answers for Success
Master Class 8 Science: Engaging Questions & Answers for Success
Class 8 Question and Answer - Your Ultimate Solutions Guide
Master Class 8 Maths: Engaging Questions & Answers for Success
Master Class 8 Social Science: Engaging Questions & Answers for Success
Master Class 5 English: Engaging Questions & Answers for Success
Trending doubts
In Indian rupees 1 trillion is equal to how many c class 8 maths CBSE
What is BLO What is the full form of BLO class 8 social science CBSE
What helps Frog to breathe underwater class 8 biology CBSE
Citizens of India can vote at the age of A 18 years class 8 social science CBSE
Full form of STD, ISD and PCO
What is the feminine gender of a stag class 8 english CBSE