


The number of students in a hostel, speaking different languages is given below:
Display the data in a pie chart:
Language Hindi English Marathi Tamil Bengali Total Number of students 40 12 9 7 4 72
| Language | Hindi | English | Marathi | Tamil | Bengali | Total |
| Number of students | 40 | 12 | 9 | 7 | 4 | 72 |
Answer
594.3k+ views
Hint: Here representing the given data in a graphical way, or presenting it graphically which is called as the graphical representation, which refers to visually displaying and analyzing with the use of charts and graphs, which is also used to interpret numerical data. Here using a pie chart which is also called a circle graph, as it is a circular statistical graph, which is divided into pies (called slices) to illustrate the numerical proportion of the data.
Complete step-by-step solution:
Here in the problem given the data of the students who speak their respective language.
Given that how many students speak a particular language in the hostel.
$ \Rightarrow $No. of students that speak hindi = 40
$ \Rightarrow $No. of students that speak english = 12
$ \Rightarrow $No. of students that speak marathi = 9
$ \Rightarrow $No. of students that speak tamil = 7
$ \Rightarrow $No. of students that speak bengali = 4
Given that the total no. of students = 72
Now calculating the percentage of Hindi speaking people:
As the no. of students that speak Hindi = 40
The total no. of students = 72
$ \Rightarrow \dfrac{{40}}{{72}} \times 100 = 0.555$
$ \Rightarrow 55.5\% \approx 56\% $
$\therefore $The percentage of Hindi speaking students = 56%
The percentage of English speaking students:
$ \Rightarrow \dfrac{{12}}{{72}} \times 100 = 0.166$
$ \Rightarrow 16.6\% \approx 17\% $
$\therefore $The percentage of Hindi speaking students = 17%
The percentage of Marathi speaking students:
$ \Rightarrow \dfrac{9}{{72}} \times 100 = 0.125$
$ \Rightarrow 12.5\% \approx 12\% $
$\therefore $The percentage of Marathi speaking students = 12%
The percentage of Tamil speaking students:
$ \Rightarrow \dfrac{7}{{72}} \times 100 = 0.097$
$ \Rightarrow 9.72\% \approx 10\% $
$\therefore $The percentage of Tamil speaking students = 10%
The percentage of Bengali speaking students:
$ \Rightarrow \dfrac{4}{{72}} \times 100 = 0.055$
$ \Rightarrow 5.55\% \approx 5\% $
$\therefore $The percentage of Bengali speaking students = 5%
$\therefore $The pie chart can be made according to the percentages as:
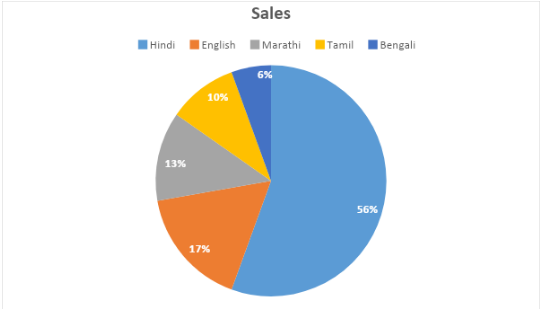
Note: The data can be represented in any graphical format but pie charts are the best for displaying data for around 6 categories or lower. Pie chart is a structural graph which is divided into many parts and each part representing the amount of proportion of an item from the entire proportion.
Complete step-by-step solution:
Here in the problem given the data of the students who speak their respective language.
Given that how many students speak a particular language in the hostel.
$ \Rightarrow $No. of students that speak hindi = 40
$ \Rightarrow $No. of students that speak english = 12
$ \Rightarrow $No. of students that speak marathi = 9
$ \Rightarrow $No. of students that speak tamil = 7
$ \Rightarrow $No. of students that speak bengali = 4
Given that the total no. of students = 72
Now calculating the percentage of Hindi speaking people:
As the no. of students that speak Hindi = 40
The total no. of students = 72
$ \Rightarrow \dfrac{{40}}{{72}} \times 100 = 0.555$
$ \Rightarrow 55.5\% \approx 56\% $
$\therefore $The percentage of Hindi speaking students = 56%
The percentage of English speaking students:
$ \Rightarrow \dfrac{{12}}{{72}} \times 100 = 0.166$
$ \Rightarrow 16.6\% \approx 17\% $
$\therefore $The percentage of Hindi speaking students = 17%
The percentage of Marathi speaking students:
$ \Rightarrow \dfrac{9}{{72}} \times 100 = 0.125$
$ \Rightarrow 12.5\% \approx 12\% $
$\therefore $The percentage of Marathi speaking students = 12%
The percentage of Tamil speaking students:
$ \Rightarrow \dfrac{7}{{72}} \times 100 = 0.097$
$ \Rightarrow 9.72\% \approx 10\% $
$\therefore $The percentage of Tamil speaking students = 10%
The percentage of Bengali speaking students:
$ \Rightarrow \dfrac{4}{{72}} \times 100 = 0.055$
$ \Rightarrow 5.55\% \approx 5\% $
$\therefore $The percentage of Bengali speaking students = 5%
$\therefore $The pie chart can be made according to the percentages as:
Note: The data can be represented in any graphical format but pie charts are the best for displaying data for around 6 categories or lower. Pie chart is a structural graph which is divided into many parts and each part representing the amount of proportion of an item from the entire proportion.
Recently Updated Pages
Master Class 11 Social Science: Engaging Questions & Answers for Success
Master Class 11 English: Engaging Questions & Answers for Success
Master Class 11 Maths: Engaging Questions & Answers for Success
Master Class 11 Chemistry: Engaging Questions & Answers for Success
Master Class 11 Biology: Engaging Questions & Answers for Success
Master Class 11 Physics: Engaging Questions & Answers for Success
Trending doubts
Differentiate between an exothermic and an endothermic class 11 chemistry CBSE
One Metric ton is equal to kg A 10000 B 1000 C 100 class 11 physics CBSE
Difference Between Prokaryotic Cells and Eukaryotic Cells
There are 720 permutations of the digits 1 2 3 4 5 class 11 maths CBSE
Draw a diagram of a plant cell and label at least eight class 11 biology CBSE
1 Quintal is equal to a 110 kg b 10 kg c 100kg d 1000 class 11 physics CBSE