


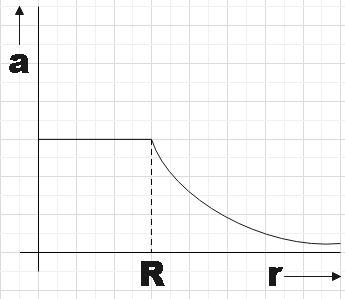
The mass density of a spherical body is given by $\rho \left( r \right)=\dfrac{k}{r}$ for $r\le R$ and $\rho \left( r \right)=0$ for$r\rangle R$, where r is the distance from the centre. The correct graph that describes qualitatively the acceleration a of a test particle as function of r is:
A.
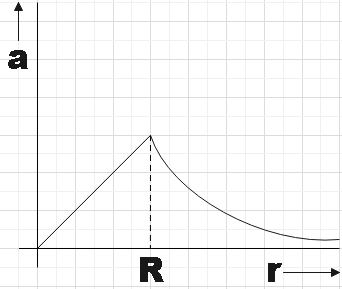
B.
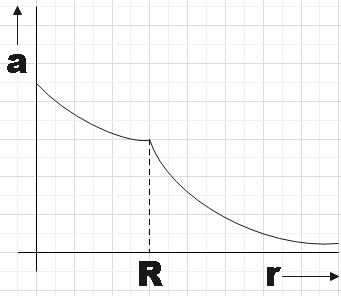
C.
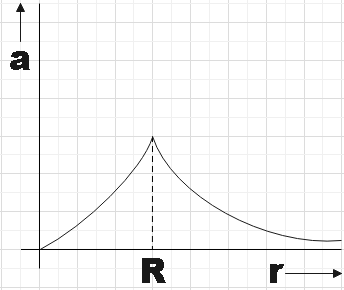
D.
Answer
568.2k+ views
Hint: You could first read the question and thus understand the situation properly. You could maybe find some relation that gives the dependency of acceleration of a test particle with distance as these are two parameters of which we are supposed to make a plot. Otherwise you could do it for parameters that have direct dependency on acceleration.
Formula used:
Electric force,
$F=qE$
Ampere’s circuital law,
$\int{E.dA=\dfrac{Q}{{{\varepsilon }_{0}}}}$
Complete answer:
We know that the electrostatic force could be given by,
$F=qE$
$\Rightarrow ma=qE$
So we could say that for a test particle of mass m and charge q, its acceleration would be directly proportional to electric field. That is,
$a\alpha E$ ………………………………………….. (1)
Now we could check the dependency of the electric field with distance r from the given conditions.
For $r\le R$ the mass density is given as,
$\rho \left( r \right)=\dfrac{k}{r}$
So we could say that charge contained within a sphere of radius r would be,
$Q=\int{\dfrac{k}{r}}dr\times 4\pi {{r}^{2}}=4k\pi \left( \dfrac{{{r}^{2}}}{2} \right)=2k\pi {{r}^{2}}$ ………………………………………… (2)
From ampere’s circuital we know that,
$\int{E.dA=\dfrac{Q}{{{\varepsilon }_{0}}}}$
$\Rightarrow E\left( 4\pi {{r}^{2}} \right)=\dfrac{Q}{{{\varepsilon }_{0}}}$
From (2),
$E=\dfrac{2k\pi {{r}^{2}}}{4\pi {{\varepsilon }_{0}}{{r}^{2}}}=\dfrac{k}{2{{\varepsilon }_{0}}}$ ……………………………………. (3)
Therefore, we found that the electric field doesn’t depend on distance r and would be constant for $r\le R$ and so will be the acceleration of the test particle.
For $r\ge R,$ there is no dependency of mass density with distance, so,
$E=\dfrac{kQ}{{{r}^{2}}}$
So, we see that there is an inverse square dependence of the electric field with distance and so will the acceleration. So, we could say that if plot acceleration against distance the plot would look like the one in option A.
So option A is the correct answer.
Note: In questions like these where we are supposed to make a plot, we should take off the intervals that are taken into consideration. For example, here we have two intervals: one that is 0 to R and the region that is beyond R. We are also given necessary points for making the plot for the respective regions to make it easier.
Recently Updated Pages
Master Class 12 Economics: Engaging Questions & Answers for Success
Master Class 12 English: Engaging Questions & Answers for Success
Master Class 12 Social Science: Engaging Questions & Answers for Success
Master Class 12 Maths: Engaging Questions & Answers for Success
Master Class 12 Physics: Engaging Questions & Answers for Success
Master Class 12 Business Studies: Engaging Questions & Answers for Success
Trending doubts
Which are the Top 10 Largest Countries of the World?
Draw a labelled sketch of the human eye class 12 physics CBSE
Differentiate between homogeneous and heterogeneous class 12 chemistry CBSE
Why is the cell called the structural and functional class 12 biology CBSE
Draw ray diagrams each showing i myopic eye and ii class 12 physics CBSE
Which is the correct genotypic ratio of mendel dihybrid class 12 biology CBSE