


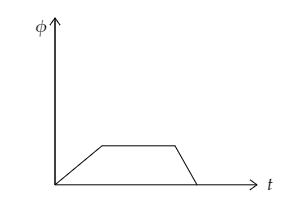
The magnetic flux linked through the coil changed with respect to time according to the following graph, then sketched the graph between the induced emf and the time.
Answer
590.4k+ views
Hint: Faraday’s law of induction states that an emf is induced in a coil when the magnetic flux associated with the coil changes with time. However, the emf induced will oppose the change in the magnetic flux associated with the coil. So the induced emf will be the negative of the rate of change of the magnetic flux with respect to time.
Formula used:
-The emf induced in a circuit is given by, $\varepsilon = - N\dfrac{{d{\phi _B}}}{{dt}}$ where ${\phi _B}$ is the magnetic flux associated with the circuit, $N$ is the number of turns on the coil and $t$ is the time.
Complete step by step solution:
Step 1: Sketch the given graph between the magnetic flux and time and separate the curve into three parts.
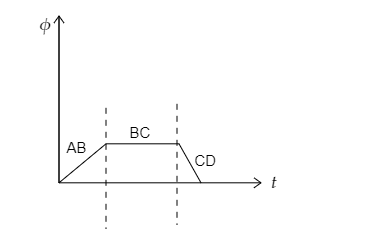
In the below figure, we have split the given curve depicting the variation of the magnetic flux, associated with the coil, with time into three line segments – AB, BC and CD.
Step 2: Using the relation for the induced emf, sketch the curve between the induced emf and time for each line segments AB, BC and CD.
The emf induced in the coil can be expressed as $\varepsilon = - N\dfrac{{d{\phi _B}}}{{dt}}$ ------- (1) where ${\phi _B}$ is the magnetic flux associated with the circuit, $N$ is the number of turns on the coil and $t$ is the time.
Consider AB, the magnetic flux increases with time i.e., $\dfrac{{d{\phi _B}}}{{dt}} > 0$ and so the induced emf according to equation (1) will be negative and constant with time i.e., $\varepsilon = - ve$ .
For BC, $\dfrac{{d{\phi _B}}}{{dt}} = 0$ as the magnetic flux is constant. So according to equation (1), the induced emf will also be zero i.e., $\varepsilon = 0$ .
For CD, the magnetic flux decreases with time i.e. $\dfrac{{d{\phi _B}}}{{dt}} < 0$ and drops to zero. So according to equation (1), the induced emf will be positive and constant with time i.e., $\varepsilon = + ve$ .
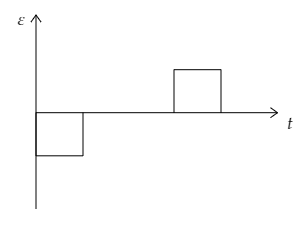
Combining all these results the graph depicting the variation of the induced emf with time is sketched below.
Note:
The term $\dfrac{{d{\phi _B}}}{{dt}}$ refers to the slope of the line segment. So the induced emf is essentially the negative of the slope of the line depicting the variation of the magnetic flux with time. So for a linearly increasing magnetic flux (AB), the slope will be constant but negative and for a linearly decreasing magnetic flux (CD), the slope will be constant but positive. For the line segment BC, the magnetic flux remained constant with time. An emf will be induced only when there is a change in the magnetic flux. So for that part, the induced emf will be zero.
Formula used:
-The emf induced in a circuit is given by, $\varepsilon = - N\dfrac{{d{\phi _B}}}{{dt}}$ where ${\phi _B}$ is the magnetic flux associated with the circuit, $N$ is the number of turns on the coil and $t$ is the time.
Complete step by step solution:
Step 1: Sketch the given graph between the magnetic flux and time and separate the curve into three parts.
In the below figure, we have split the given curve depicting the variation of the magnetic flux, associated with the coil, with time into three line segments – AB, BC and CD.
Step 2: Using the relation for the induced emf, sketch the curve between the induced emf and time for each line segments AB, BC and CD.
The emf induced in the coil can be expressed as $\varepsilon = - N\dfrac{{d{\phi _B}}}{{dt}}$ ------- (1) where ${\phi _B}$ is the magnetic flux associated with the circuit, $N$ is the number of turns on the coil and $t$ is the time.
Consider AB, the magnetic flux increases with time i.e., $\dfrac{{d{\phi _B}}}{{dt}} > 0$ and so the induced emf according to equation (1) will be negative and constant with time i.e., $\varepsilon = - ve$ .
For BC, $\dfrac{{d{\phi _B}}}{{dt}} = 0$ as the magnetic flux is constant. So according to equation (1), the induced emf will also be zero i.e., $\varepsilon = 0$ .
For CD, the magnetic flux decreases with time i.e. $\dfrac{{d{\phi _B}}}{{dt}} < 0$ and drops to zero. So according to equation (1), the induced emf will be positive and constant with time i.e., $\varepsilon = + ve$ .
Combining all these results the graph depicting the variation of the induced emf with time is sketched below.
Note:
The term $\dfrac{{d{\phi _B}}}{{dt}}$ refers to the slope of the line segment. So the induced emf is essentially the negative of the slope of the line depicting the variation of the magnetic flux with time. So for a linearly increasing magnetic flux (AB), the slope will be constant but negative and for a linearly decreasing magnetic flux (CD), the slope will be constant but positive. For the line segment BC, the magnetic flux remained constant with time. An emf will be induced only when there is a change in the magnetic flux. So for that part, the induced emf will be zero.
Recently Updated Pages
Master Class 12 Social Science: Engaging Questions & Answers for Success
Master Class 12 Physics: Engaging Questions & Answers for Success
Master Class 12 Maths: Engaging Questions & Answers for Success
Master Class 12 Economics: Engaging Questions & Answers for Success
Master Class 12 Chemistry: Engaging Questions & Answers for Success
Master Class 12 Business Studies: Engaging Questions & Answers for Success
Trending doubts
Which are the Top 10 Largest Countries of the World?
Draw a labelled sketch of the human eye class 12 physics CBSE
Explain the structure of megasporangium class 12 biology CBSE
What are the major means of transport Explain each class 12 social science CBSE
How many chromosomes are found in human ovum a 46 b class 12 biology CBSE
The diagram of the section of a maize grain is given class 12 biology CBSE