


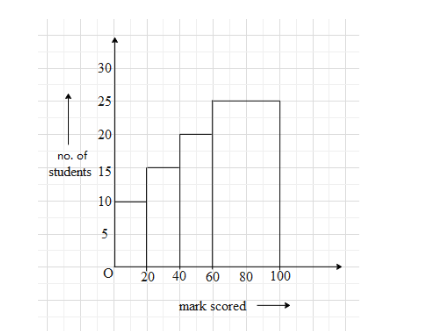
The frequency distribution has been represented graphically as follows:
Marks 0-20 20-40 40-60 60-100 No. of students 10 15 20 25
Do you think this representation is correct or incorrect?
A. correct
B. incorrect
C. ambiguous
D. data insufficient
| Marks | 0-20 | 20-40 | 40-60 | 60-100 |
| No. of students | 10 | 15 | 20 | 25 |
Answer
594.6k+ views
Hint: Study the given frequency distribution table of the number of students and the marks scored by them. Then interpret the given graph and write the frequency distribution for it. Then check when it matches with the given data.
Complete step-by-step answer:
According to the table given in the question, the marks are divided into four intervals. The first interval is from 0 marks to 20 marks. The second interval is from 20 marks to 40 marks, the third interval is from 40 marks to 60 marks. The range of the last interval is 40 marks from 60 to 100.
In the second row of the table, the numbers of students that have scored marks from that particular interval are given.
It shows that 10 students have scored marks between 0-20.
15 students have scored marks between 20-40.
20 students have scored marks between 40-60.
25 students have scored marks between 60-100.
In the given graph, the x-axis is representing the marks scored by the students and y-axis is representing the number of students.
The graph is showing that the number of students that scored marks between 0-20 are 10.
The number of students that scored marks between 20-40 are 15.
The number of students that scored marks between 40-60 are 20.
The number of students that scored marks between 60-100 are 12.
And this data matches with the data that we found from the given table.
Therefore, the given graph for the frequency distribution is correct.
So, the correct answer is “Option A”.
Note: Let us calculate the average marks scored by a student.
The class marks of the intervals 0-20, 20-40, 40-60 and 60-100 are 10, 30, 50 and 80.
The average marks scored by a student is equal to the sum of the products of the class mark of an interval and the number of students who scored marks belonging to that interval divided by the total number of students.
The total number of students is $ 10+15+20+25=70 $ .
Therefore, the average marks scored by a student are $ \dfrac{(10)(10)+(30)(15)+(50)(20)+(80)(25)}{70}=\dfrac{3145}{70}=44.92\approx 45marks $ .
Recently Updated Pages
Master Class 12 Business Studies: Engaging Questions & Answers for Success
Master Class 12 Biology: Engaging Questions & Answers for Success
Master Class 12 Chemistry: Engaging Questions & Answers for Success
Class 12 Question and Answer - Your Ultimate Solutions Guide
Master Class 11 Social Science: Engaging Questions & Answers for Success
Master Class 11 English: Engaging Questions & Answers for Success
Trending doubts
What is the Full Form of ICSE / ISC ?
Fill the blanks with the suitable prepositions 1 The class 9 english CBSE
Difference Between Plant Cell and Animal Cell
How many hours before the closure of election must class 9 social science CBSE
What is pollution? How many types of pollution? Define it
Name 10 Living and Non living things class 9 biology CBSE