


The following table shows the number of students with different hobbies. Represent the data with the help of the pie chart.
Hobby Singing Painting Cooking Gardening Reading Number of students $ 42 $ $ 28 $ $ 12 $ $ 18 $ $ 44 $
| Hobby | Singing | Painting | Cooking | Gardening | Reading |
| Number of students | $ 42 $ | $ 28 $ | $ 12 $ | $ 18 $ | $ 44 $ |
Answer
596.4k+ views
Hint: A pie chart is the circular graph which is divided into slices which demonstrates the numerical proportion where the arc length of each slice is directly proportional to the quantity which it represents. Here first of all we will find the total number of students and with that will find out the arc or the measure of the angle taking base angle of the circle equal to $ 360^\circ $
Complete step-by-step answer:
Total number of students is equal to the sum of all the students with all the different hobbies.
Total number of students $ = 42 + 28 + 12 + 18 + 44 $
Total number of students $ = 144 $
Convert the number of students in the form of the angle for each of the hobbies.
Singing $ = 42 $ students
$ = \dfrac{{42}}{{144}} \times 360 $
Remove the common factors and simplify the above equation –
$ = 105^\circ $ ..... (A)
Similarly, Painting $ = 28 $ students
$ = \dfrac{{28}}{{144}} \times 360 $
Remove the common factors and simplify the above equation –
$ = 70^\circ $ ..... (B)
Cooking $ = 12 $ students
$ = \dfrac{{12}}{{144}} \times 360 $
Remove the common factors and simplify the above equation –
$ = 30^\circ $ .... (C)
Gardening $ = 18 $ students
$ = \dfrac{{18}}{{144}} \times 360 $
Remove the common factors and simplify the above equation –
$ = 45^\circ $ ..... (D)
Reading $ = 44 $ students
$ = \dfrac{{44}}{{144}} \times 360 $
Remove the common factors and simplify the above equation –
$ = 110^\circ $ .... (E)
Just represent the calculated in the tabular form –
Draw the respective angles using the circle-
Note: Be good in multiples and the simplification since; these may alter the solution completely. Also, refer to the other graphical presentation of the chart and the methods and the difference among them. The chart is the graphical representation of the data, where data can be represented by symbols such as the bars, lines, slices in the pie chart.
Complete step-by-step answer:
Total number of students is equal to the sum of all the students with all the different hobbies.
Total number of students $ = 42 + 28 + 12 + 18 + 44 $
Total number of students $ = 144 $
Convert the number of students in the form of the angle for each of the hobbies.
Singing $ = 42 $ students
$ = \dfrac{{42}}{{144}} \times 360 $
Remove the common factors and simplify the above equation –
$ = 105^\circ $ ..... (A)
Similarly, Painting $ = 28 $ students
$ = \dfrac{{28}}{{144}} \times 360 $
Remove the common factors and simplify the above equation –
$ = 70^\circ $ ..... (B)
Cooking $ = 12 $ students
$ = \dfrac{{12}}{{144}} \times 360 $
Remove the common factors and simplify the above equation –
$ = 30^\circ $ .... (C)
Gardening $ = 18 $ students
$ = \dfrac{{18}}{{144}} \times 360 $
Remove the common factors and simplify the above equation –
$ = 45^\circ $ ..... (D)
Reading $ = 44 $ students
$ = \dfrac{{44}}{{144}} \times 360 $
Remove the common factors and simplify the above equation –
$ = 110^\circ $ .... (E)
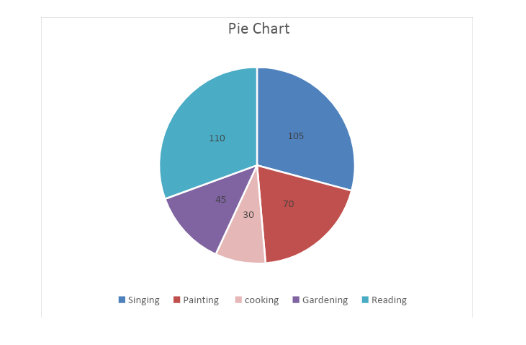
Just represent the calculated in the tabular form –
| Hobby | Number of Students | Degree |
| Singing | $ 42 $ | $ 105^\circ $ |
| Painting | $ 28 $ | $ 70^\circ $ |
| Cooking | $ 12 $ | $ 30^\circ $ |
| Gardening | $ 18 $ | $ 45^\circ $ |
| Reading | $ 44 $ | $ 110^\circ $ |
Draw the respective angles using the circle-
Note: Be good in multiples and the simplification since; these may alter the solution completely. Also, refer to the other graphical presentation of the chart and the methods and the difference among them. The chart is the graphical representation of the data, where data can be represented by symbols such as the bars, lines, slices in the pie chart.
Recently Updated Pages
Master Class 12 Business Studies: Engaging Questions & Answers for Success
Master Class 12 Biology: Engaging Questions & Answers for Success
Master Class 12 Chemistry: Engaging Questions & Answers for Success
Class 12 Question and Answer - Your Ultimate Solutions Guide
Master Class 11 Social Science: Engaging Questions & Answers for Success
Master Class 11 English: Engaging Questions & Answers for Success
Trending doubts
Find the sum of series 1 + 2 + 3 + 4 + 5 + + 100 class 9 maths CBSE
Fill the blanks with the suitable prepositions 1 The class 9 english CBSE
Difference Between Plant Cell and Animal Cell
How many hours before the closure of election must class 9 social science CBSE
What is pollution? How many types of pollution? Define it
Name 10 Living and Non living things class 9 biology CBSE