


The following distribution gives the daily income of $50$ workers of a factory.
Daily income(in Rs) $100 - 120$ $120 - 140$ $140 - 160$ $160 - 180$ $180 - 200$ Number of workers $12$ $14$ $8$ $6$ $10$
Convert the distribution above to a less than type cumulative frequency distribution, and draw its ogive.
| Daily income(in Rs) | $100 - 120$ | $120 - 140$ | $140 - 160$ | $160 - 180$ | $180 - 200$ |
| Number of workers | $12$ | $14$ | $8$ | $6$ | $10$ |
Answer
584.7k+ views
Hint: To represent the data in the table graphically, we mark the upper limits of the class intervals on the x-axis and their corresponding cumulative frequencies on the y-axis by choosing a convenient scale.
Complete step-by-step answer:
The frequency distribution table of less than type is as follows:
Now, taking upper class limits of class intervals on x-axis and their respective cumulative frequencies on y-axis and then plot the points $\left( {120,12} \right)$,$\left( {140,26} \right)$,$\left( {160,34} \right)$,$\left( {180,40} \right)$&$\left( {200,50} \right)$.
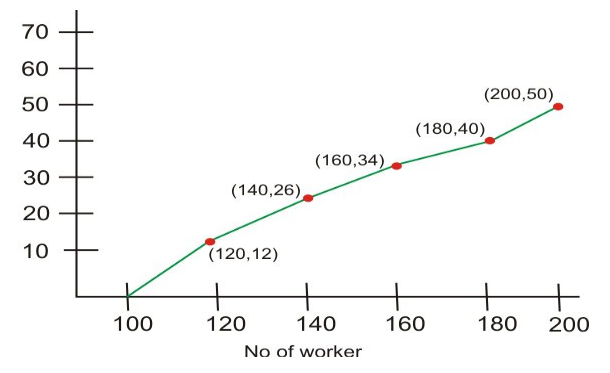
Note: In less than type cumulative frequency curve or an ogive, the points are plotted in the ordered pairs given by (Upper limit, Corresponding cumulative frequency).
Complete step-by-step answer:
The frequency distribution table of less than type is as follows:
| Daily income(in Rs)(Upper class limits) | Cumulative frequency |
| Less than $120$ | $12$ |
| Less than $140$ | $12 + 14 = 26$ |
| Less than $160$ | $26 + 8 = 34$ |
| Less than $180$ | $34 + 6 = 40$ |
| Less than $200$ | $40 + 10 = 50$ |
Now, taking upper class limits of class intervals on x-axis and their respective cumulative frequencies on y-axis and then plot the points $\left( {120,12} \right)$,$\left( {140,26} \right)$,$\left( {160,34} \right)$,$\left( {180,40} \right)$&$\left( {200,50} \right)$.
Note: In less than type cumulative frequency curve or an ogive, the points are plotted in the ordered pairs given by (Upper limit, Corresponding cumulative frequency).
Recently Updated Pages
Master Class 12 Economics: Engaging Questions & Answers for Success
Master Class 12 Physics: Engaging Questions & Answers for Success
Master Class 12 English: Engaging Questions & Answers for Success
Master Class 12 Social Science: Engaging Questions & Answers for Success
Master Class 12 Maths: Engaging Questions & Answers for Success
Master Class 12 Business Studies: Engaging Questions & Answers for Success
Trending doubts
Which are the Top 10 Largest Countries of the World?
What are the major means of transport Explain each class 12 social science CBSE
Draw a labelled sketch of the human eye class 12 physics CBSE
Why cannot DNA pass through cell membranes class 12 biology CBSE
Differentiate between insitu conservation and exsitu class 12 biology CBSE
Draw a neat and well labeled diagram of TS of ovary class 12 biology CBSE