


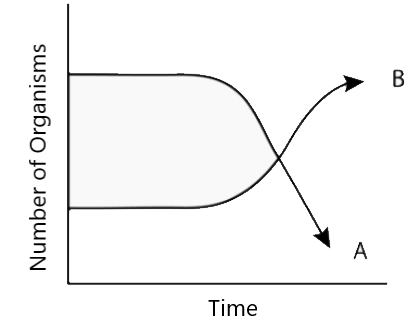
The above graph depicts changes in two populations (A and B) of herbivores in a grassy field A, possible reason for these changes is that?
Answer
561k+ views
Hint: The above graph depicts that the two populations A and B (herbivores) are competing with each other to graze in field A. The graph represents a number of organisms on the Y-axis to that of the rate of time on the X-axis.
Complete answer:
As time increases, the number of organisms present in population A tends to decrease and the number of organisms present in population B seems to increase. This could be an intraspecific competition between populations A and B of herbivores. Since organisms present in both the population compete for the same resource, this becomes a positive game as there is one winner and a loser. The organisms in population B are seen to be increased as they could have better adapted to their environment. They proved their superiority in survival and utilization of resources than population A. Therefore, In contrast with population A, population B is more competitive, which is why the majority of organisms in population B has increased, while population A has declined as they have access to fewer resources.
Additional Information:
In an environment, there are several different forms of relationships between organisms and it is not unusual for any specific organism to wear multiple hats and play distinct responsibilities at varying times. Competition even exists for resources among humans. Encounters between species, including humans, are the essence of life and have a measurable influence on the ecosystem's functionality and well-being. In a community, individual organisms live together and survive upon one another. They generally have many kinds of interactions with each other, and for their existence, many of these interactions are crucial.
Note: The two populations are said to be herbivorous, so they can not consume or feed on each other. If the food resources for A and B had decreased, then both A and B populations would have decreased. If there were more offspring in population A, then graph A tends to be increased.
Recently Updated Pages
Master Class 12 Economics: Engaging Questions & Answers for Success
Master Class 12 Physics: Engaging Questions & Answers for Success
Master Class 12 English: Engaging Questions & Answers for Success
Master Class 12 Social Science: Engaging Questions & Answers for Success
Master Class 12 Maths: Engaging Questions & Answers for Success
Master Class 12 Business Studies: Engaging Questions & Answers for Success
Trending doubts
Which are the Top 10 Largest Countries of the World?
What are the major means of transport Explain each class 12 social science CBSE
Draw a labelled sketch of the human eye class 12 physics CBSE
Why cannot DNA pass through cell membranes class 12 biology CBSE
Differentiate between insitu conservation and exsitu class 12 biology CBSE
Draw a neat and well labeled diagram of TS of ovary class 12 biology CBSE