


Study the age pyramids given below and select the correct statement regarding these.
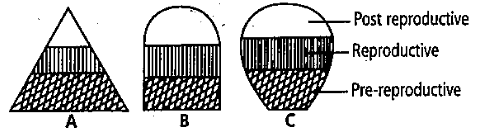
A)A is a triangular age pyramid, where the pre-production stage is very large as compared to the reproductive and post-reproductive stages of the population. This type of age structure indicates that the population would increase rapidly.
B)B is an inverted bell shaped age pyramid, where the number of pre-reproductive and reproductive and reproductive individuals is almost equal. This type of age structure indicates that the population is stable.
C)C is an urn shaped age pyramid, where more number of reproductive individuals are present. This type of age structure indicates that the population is declining.
D)All of these
Answer
585k+ views
Hint: Age pyramid is an illustration of the population of a specific area under consideration in which reproductive, post reproductive and pre-reproductive stages of the individuals are taken into account.
Complete answer:
The age pyramid individuals of various age groups at a given time. It is the easiest way to represent age distribution. This pyramid gives the idea of whether the population is expanding, stable or diminishing
Option A: A is the pyramid-shaped graph in which the successive generation will be more than the preceding one i.e. high young individual in a population. This means the young individuals can reproduce and contribute to the population size. The expanding population is seen in the case of housefly, yeast, alga. Therefore this graph represents an expanding population. This is the correct statement.
Option B: B graph is inverted bell and shows that pre-reproductive and reproductive age groups are more or less equal in size, indicating moderate proportions of young to old individuals. This graph represents a stable population. Therefore this is the correct statement.
Option C: C graphs indicate a low number of young individuals. If the birth rate is reduced then the pre-reproductive stage is less in proportion to reproductive and post-reproductive groups i.e. diminishing population, this results in an urn-shaped graph. Therefore, this is the correct statement.
Option D: Since all the above options are true therefore D is the correct answer
Hence, the correct answer is option (D)
Note: Age pyramids are used widely to study population and draw conclusions about their reproductive conditions and state for further studies to be conducted. The above graphs i.e. pyramid-shaped, urn-shaped, and bell-shaped graphs are hypothetical age pyramids not only tell about the ratio of age groups but also indicate the population is expanding or diminishing.
Recently Updated Pages
Master Class 9 General Knowledge: Engaging Questions & Answers for Success
Master Class 9 Maths: Engaging Questions & Answers for Success
Master Class 9 Science: Engaging Questions & Answers for Success
Master Class 9 English: Engaging Questions & Answers for Success
Master Class 9 Social Science: Engaging Questions & Answers for Success
Class 9 Question and Answer - Your Ultimate Solutions Guide
Trending doubts
Which are the Top 10 Largest Countries of the World?
Draw a labelled sketch of the human eye class 12 physics CBSE
Differentiate between homogeneous and heterogeneous class 12 chemistry CBSE
Sulphuric acid is known as the king of acids State class 12 chemistry CBSE
Why is the cell called the structural and functional class 12 biology CBSE
A dentist uses a small mirror that gives a magnification class 12 physics CBSE