


What steps do you follow in plotting a graph?
Answer
521.1k+ views
Hint: As we know that a graph can be defined as a pictorial representation or a diagram that represents data or values in an organized manner. We should know that there are different types of graphs such as bar graphs, block graphs, column graphs and so on. Here we have to understand how to plot a graph and we will solve it with an example.
Complete step-by-step answer:
We should note the following steps while plotting a graph:
We should always have a graph with fine enough divisions to give useful information.
After this, we need to draw the $ x - $ axis and $ y - $ axis and then divide them properly.
We can after add the data points on the graph. After that we need to draw the shape formed, it can be either straight line or curve.
We can give the graph a title and then collect the information from the graph.
Let us take an equation i.e. $ 5x - 3y = 15 $ , two variables $ x $ and $ y $ .
Let $ x = 0 $ , putting the value of $ x $ in equation we have,
$ 5 \times (0) - 3y = 15 \Rightarrow 0 - 3y = 15 $ ,
By isolating the term $ y $ we get,
$ y = \dfrac{{15}}{{ - 3}} $ .
Therefore $ y = - 5 $ .
Now let $ y = 0 $ , again putting the value of $ y $ in equation,
$ 5x - 3(0) = 15 \Rightarrow 5x = 15 $ ,
Again by isolating the term $ x $ we get,
$ x = 3 $ .
So $ x = 3 $ .
Putting the values of $ x $ and $ y $ in tabular form, we have
Now we can plot the coordinates in the graph:
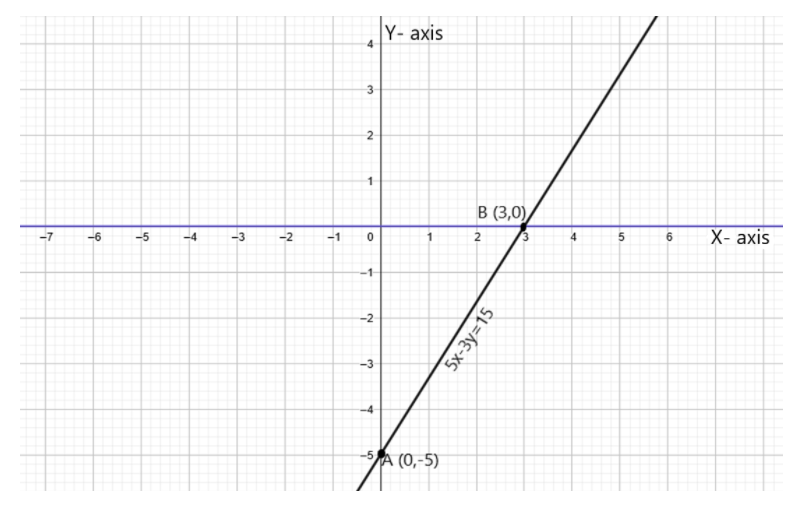
Here the coordinates are $ A(0, - 5) $ and $ B(3,0) $ in the graph above. Similarly if we take any other value for points, it will also satisfy the equation $ 5x - 3y = 15 $ .
Hence the coordinates of the given equation in the graph are $ A(0, - 5) $ and $ B(3,0) $ .
Note: We should note that the above given equation is a linear equation in two variables. Any equation that can be represented in the form $ ax + by + c = 0 $ , where $ a,b $ and $ c $ are real numbers and $ a,b $ are not equal to $ 0 $ , is called a linear equation in two variables.
From the above solution we can conclude that each point on the line will be the solution of the equation and each solution of the equation will be some point on the line. So we plot every linear equation in two variables in a graph as a straight line in a coordinate plane as in the above equation.
Complete step-by-step answer:
We should note the following steps while plotting a graph:
We should always have a graph with fine enough divisions to give useful information.
After this, we need to draw the $ x - $ axis and $ y - $ axis and then divide them properly.
We can after add the data points on the graph. After that we need to draw the shape formed, it can be either straight line or curve.
We can give the graph a title and then collect the information from the graph.
Let us take an equation i.e. $ 5x - 3y = 15 $ , two variables $ x $ and $ y $ .
Let $ x = 0 $ , putting the value of $ x $ in equation we have,
$ 5 \times (0) - 3y = 15 \Rightarrow 0 - 3y = 15 $ ,
By isolating the term $ y $ we get,
$ y = \dfrac{{15}}{{ - 3}} $ .
Therefore $ y = - 5 $ .
Now let $ y = 0 $ , again putting the value of $ y $ in equation,
$ 5x - 3(0) = 15 \Rightarrow 5x = 15 $ ,
Again by isolating the term $ x $ we get,
$ x = 3 $ .
So $ x = 3 $ .
Putting the values of $ x $ and $ y $ in tabular form, we have
| $ x $ | $ 0 $ | $ 3 $ |
| $ y $ | $ - 5 $ | $ 0 $ |
Now we can plot the coordinates in the graph:
Here the coordinates are $ A(0, - 5) $ and $ B(3,0) $ in the graph above. Similarly if we take any other value for points, it will also satisfy the equation $ 5x - 3y = 15 $ .
Hence the coordinates of the given equation in the graph are $ A(0, - 5) $ and $ B(3,0) $ .
Note: We should note that the above given equation is a linear equation in two variables. Any equation that can be represented in the form $ ax + by + c = 0 $ , where $ a,b $ and $ c $ are real numbers and $ a,b $ are not equal to $ 0 $ , is called a linear equation in two variables.
From the above solution we can conclude that each point on the line will be the solution of the equation and each solution of the equation will be some point on the line. So we plot every linear equation in two variables in a graph as a straight line in a coordinate plane as in the above equation.
Recently Updated Pages
Master Class 8 Social Science: Engaging Questions & Answers for Success
Master Class 8 Science: Engaging Questions & Answers for Success
Master Class 8 Maths: Engaging Questions & Answers for Success
Class 8 Question and Answer - Your Ultimate Solutions Guide
Master Class 9 Social Science: Engaging Questions & Answers for Success
Master Class 9 Science: Engaging Questions & Answers for Success
Trending doubts
What are gulf countries and why they are called Gulf class 8 social science CBSE
What is BLO What is the full form of BLO class 8 social science CBSE
Give full form of LPG and CNG class 8 chemistry CBSE
Citizens of India can vote at the age of A 18 years class 8 social science CBSE
How do you convert dfracpi 8 radians in degrees class 8 maths CBSE
Advantages and disadvantages of science