


Sketch the graph for $y={{\sec }^{-1}}\sec x$.
Answer
625.2k+ views
Hint: In this question, we will first write secant function in terms of cos then understand the relation of $\cos x$ and ${{\cos }^{-1}}x$. We will observe the graph of $\cos x$ , and how they change signs and use it to plot a graph of $y={{\sec }^{-1}}\sec x$.
Complete step-by-step answer:
In given question, we have,
$y={{\sec }^{-1}}\sec x$
This can be written as
$\sec y=\sec x$.
We know that $\sec x=\dfrac{1}{\cos x}$, therefore, we can write above equation as,
$\dfrac{1}{\cos y}=\dfrac{1}{\cos x}$
Cross multiplying this, we get,
$\cos x=\cos y$
This can be written as,
$y={{\cos }^{-1}}\cos x$.
So, the graph of $y={{\sec }^{-1}}\sec x$ is the same as the graph of $y={{\cos }^{-1}}\cos x$.
Now, $\cos x$ is a periodic function with period $2\pi $, which means its values repeat in the same pattern after $2\pi $ increases in $x$. That is, $\cos x=\cos \left( 2\pi +x \right)$.
Since, cos x is periodic with period $2\pi $. Therefore, $y={{\cos }^{-1}}\cos x$ is also period with period $2\pi $.
Also, the domain here is a set of those values of $x$ for which ${{\cos }^{-1}}\cos x$ is defined. And, range is the set of values where ${{\cos }^{-1}}\cos x$ lies.
Now, for all real values of $x$, $\cos x$ lies between -1 and 1. And, between -1 and 1, the inverse function of cosine is defined. Therefore, ${{\cos }^{-1}}\cos x$ is defined for all real values of$x$.
We know, graph of $y=\cos x$ is:
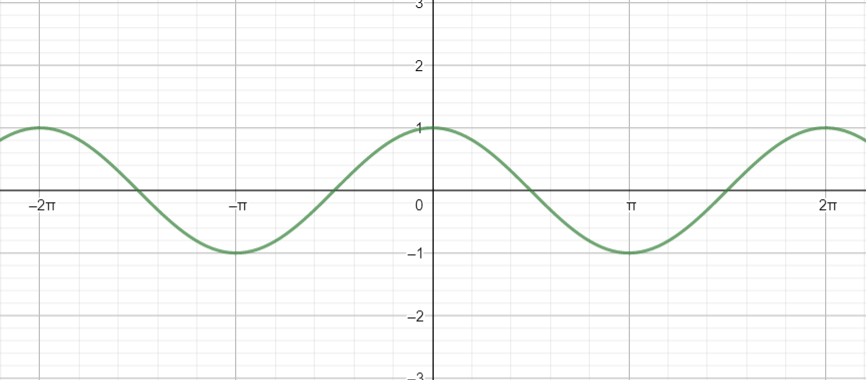
We see that, in the interval $\left[ -\pi ,\pi \right]$ , for two different values of $x$ , we have the same value of $y$.
Also, from definition of cosine inverse, in this graph, we get,
${{\cos }^{-1}}y=x$
If we substitute $y=\cos x$ here, we get,
${{\cos }^{-1}}\cos x=x$.
Now, in graph of ${{\cos }^{-1}}\cos x$, we have,
$y={{\cos }^{-1}}\cos x$
$\Rightarrow y=x$
But, in the interval $\left[ -\pi ,\pi \right]$ , for two different values of $x$ , we have the same value of $y$ .
Let those two different values be represented by ${{y}_{1}},{{y}_{2}}$.
Now, as $x$ increases from $-\pi $ to 0, $\cos x$ increases from -1 to 1, and hence, ${{\cos }^{-1}}\cos x$ decreases from $\pi $ to 0. Therefore, here we will have, ${{y}_{1}}=-x$.
And as it increases from 0 to $\pi $, $\cos x$ decreases from 1 to -1, and hence, ${{\cos }^{-1}}\cos x$ increases from 0 to $\pi $. Therefore, here we will have, ${{y}_{2}}=x$ .
Also, from $-\pi $ to$\pi $, the length of interval is $2\pi $ and ${{\cos }^{-1}}\cos x$ periodic with period $2\pi $. Therefore, the rest of the graph will repeat the same as in interval $\left[ -\pi ,\pi \right]$.
Hence, the graph of ${{\cos }^{-1}}\cos x$ is given by:
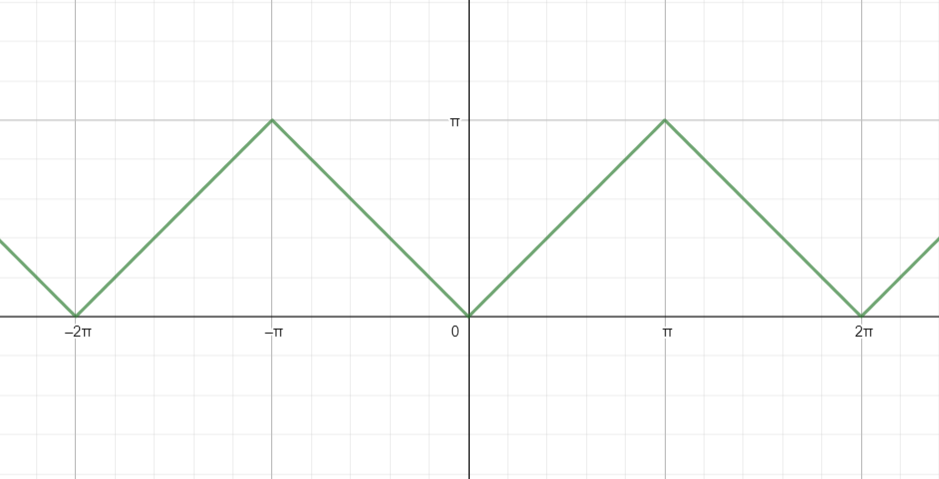
Hence for the graph of $y={{\sec }^{-1}}\sec x$ is plotted above.
Note: While plotting the graph, keep in mind that for two different values of $x$ , ${{\cos }^{-1}}\cos x$ will have the same value in interval of length $2\pi $. So, looking at $y=x$, do not directly plot a graph of an infinite straight line.
Complete step-by-step answer:
In given question, we have,
$y={{\sec }^{-1}}\sec x$
This can be written as
$\sec y=\sec x$.
We know that $\sec x=\dfrac{1}{\cos x}$, therefore, we can write above equation as,
$\dfrac{1}{\cos y}=\dfrac{1}{\cos x}$
Cross multiplying this, we get,
$\cos x=\cos y$
This can be written as,
$y={{\cos }^{-1}}\cos x$.
So, the graph of $y={{\sec }^{-1}}\sec x$ is the same as the graph of $y={{\cos }^{-1}}\cos x$.
Now, $\cos x$ is a periodic function with period $2\pi $, which means its values repeat in the same pattern after $2\pi $ increases in $x$. That is, $\cos x=\cos \left( 2\pi +x \right)$.
Since, cos x is periodic with period $2\pi $. Therefore, $y={{\cos }^{-1}}\cos x$ is also period with period $2\pi $.
Also, the domain here is a set of those values of $x$ for which ${{\cos }^{-1}}\cos x$ is defined. And, range is the set of values where ${{\cos }^{-1}}\cos x$ lies.
Now, for all real values of $x$, $\cos x$ lies between -1 and 1. And, between -1 and 1, the inverse function of cosine is defined. Therefore, ${{\cos }^{-1}}\cos x$ is defined for all real values of$x$.
We know, graph of $y=\cos x$ is:
We see that, in the interval $\left[ -\pi ,\pi \right]$ , for two different values of $x$ , we have the same value of $y$.
Also, from definition of cosine inverse, in this graph, we get,
${{\cos }^{-1}}y=x$
If we substitute $y=\cos x$ here, we get,
${{\cos }^{-1}}\cos x=x$.
Now, in graph of ${{\cos }^{-1}}\cos x$, we have,
$y={{\cos }^{-1}}\cos x$
$\Rightarrow y=x$
But, in the interval $\left[ -\pi ,\pi \right]$ , for two different values of $x$ , we have the same value of $y$ .
Let those two different values be represented by ${{y}_{1}},{{y}_{2}}$.
Now, as $x$ increases from $-\pi $ to 0, $\cos x$ increases from -1 to 1, and hence, ${{\cos }^{-1}}\cos x$ decreases from $\pi $ to 0. Therefore, here we will have, ${{y}_{1}}=-x$.
And as it increases from 0 to $\pi $, $\cos x$ decreases from 1 to -1, and hence, ${{\cos }^{-1}}\cos x$ increases from 0 to $\pi $. Therefore, here we will have, ${{y}_{2}}=x$ .
Also, from $-\pi $ to$\pi $, the length of interval is $2\pi $ and ${{\cos }^{-1}}\cos x$ periodic with period $2\pi $. Therefore, the rest of the graph will repeat the same as in interval $\left[ -\pi ,\pi \right]$.
Hence, the graph of ${{\cos }^{-1}}\cos x$ is given by:
Hence for the graph of $y={{\sec }^{-1}}\sec x$ is plotted above.
Note: While plotting the graph, keep in mind that for two different values of $x$ , ${{\cos }^{-1}}\cos x$ will have the same value in interval of length $2\pi $. So, looking at $y=x$, do not directly plot a graph of an infinite straight line.
Recently Updated Pages
How is Abiogenesis Theory Disproved Experimentally?
In a plane electromagnetic wave the electric field class 12 physics CBSE
A plane electromagnetic wave travels in vacuum along class 12 physics CBSE
The branch of science which deals with nature and natural class 10 physics CBSE
Understanding the Sun's Density: Exploring the Mass Density of a Hot Plasma - FAQs and Data Analysis
Where is the Centre for Environmental Education Located?
Trending doubts
Which are the Top 10 Largest Countries of the World?
Draw a labelled sketch of the human eye class 12 physics CBSE
Mention the role of cyanobacteria as a biofertiliz class 12 biology ICSE
An example of C4 plant is A Maize B Rice C Wheat D class 12 biology CBSE
Where does fertilization take place in human beings class 12 biology CBSE
Which of the following is the cheapest mode of transport class 12 social science CBSE