




How do you sketch one cycle of \[y=-\cos \left( \dfrac{1}{2}x \right)\]?
Answer
 Verified
606.6k+ views
Hint: To draw one cycle of the function, first we need to get the values of the variables in the sinusoidal wave equation then we need to find the coordinates of the graph to be plotted by substituting the values of x in the given range of the function’s time period. And then we get the sinusoidal waveform.
Complete step by step answer:
The graph of sine and cosine functions are waves just like sound or light waves. These are also called sinusoid as their graph can be expressed using the function:
\[y=A\cos (B(x-C))+D\]
where A is the amplitude of the wave function which describes how high and how low the crest and troughs of the wave would be respectively
B denotes the cycles (or frequency) and is used in the expression of time period taken for one complete cycle
C refers to the horizontal displacement and D is the vertical displacement.
According to the question we have to plot \[y=-\cos \left( \dfrac{1}{2}x \right)\], which is of the form of a wave function.
If we equate them, we get
\[y=-\cos \left( \dfrac{1}{2}x \right)=A\cos (Bx)\]
To get the values of the variables we will compare our wave function to the standard wave function, so we get
\[\begin{align}
& A=-1 \\
& B=\dfrac{1}{2}
\end{align}\]
That is the amplitude \[|A|=1\] and the time period \[=\dfrac{2\pi }{B}=\dfrac{2\pi }{1/2}=4\pi \]
That means one cycle of the given wave function will be completed in \[4\pi \].
Now we have the basic idea of how the wave will be but we still need the coordinates so as to plot the graph.
For getting the coordination, we will provide values of \[x=\pi ,2\pi ,3\pi ,4\pi \] and correspondingly we will get the values of y co-ordinate.
Let’s start,
1. When \[x=0\]
\[y=-\cos \left( \dfrac{1}{2}x \right)\]
Putting the value of x in y, we get,
\[\Rightarrow y=-\cos \left( \dfrac{1}{2}x \right)=-\cos ({{0}^{\circ }})=-1\]
The coordinate is \[(0,-1)\]
2. When \[x=\pi \]
Putting the value of x in y, we get,
\[\Rightarrow y=-\cos \left( \dfrac{1}{2}x \right)=-\cos \left( \dfrac{\pi }{2} \right)=0\]
Coordinate is \[(\pi ,0)\]
3. When \[x=2\pi \]
Putting the value of x in y, we get,
\[\Rightarrow y=-\cos \left( \dfrac{1}{2}x \right)=-\cos \left( \dfrac{2\pi }{2} \right)=-\cos (\pi )=-(-1)=1\]
Coordinate is \[(2\pi ,1)\]
4. When \[x=3\pi \]
Putting the value of x in y, we get,
\[\Rightarrow y=-\cos \left( \dfrac{1}{2}x \right)=-\cos \left( \dfrac{3\pi }{2} \right)=-\cos (\pi +\dfrac{\pi }{2})=-(-\cos (\dfrac{\pi }{2}))=0\]
As we know that \[\cos (\pi +\theta )=-\cos \theta \].
Coordinate is \[(3\pi ,0)\]
5. When \[x=4\pi \]
Putting the value of x in y, we get,
\[\Rightarrow y=-\cos \left( \dfrac{1}{2}x \right)=-\cos \left( \dfrac{4\pi }{2} \right)=-\cos (2\pi )=-(1)=-1\]
Coordinate is \[(4\pi ,-1)\]
We have the required coordinates so now we can plot the graph of the function which is as follows:
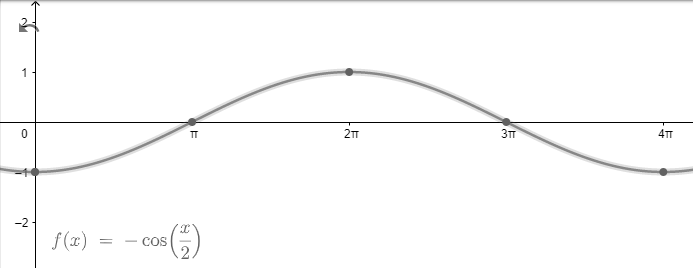
Note: Comparing the equations for finding the variables in the standard equation of sinusoidal should be done carefully using only the required form of the equation. While finding the coordinates, the coordinates should be written appropriately in the form \[(x,y)\].
Complete step by step answer:
The graph of sine and cosine functions are waves just like sound or light waves. These are also called sinusoid as their graph can be expressed using the function:
\[y=A\cos (B(x-C))+D\]
where A is the amplitude of the wave function which describes how high and how low the crest and troughs of the wave would be respectively
B denotes the cycles (or frequency) and is used in the expression of time period taken for one complete cycle
C refers to the horizontal displacement and D is the vertical displacement.
According to the question we have to plot \[y=-\cos \left( \dfrac{1}{2}x \right)\], which is of the form of a wave function.
If we equate them, we get
\[y=-\cos \left( \dfrac{1}{2}x \right)=A\cos (Bx)\]
To get the values of the variables we will compare our wave function to the standard wave function, so we get
\[\begin{align}
& A=-1 \\
& B=\dfrac{1}{2}
\end{align}\]
That is the amplitude \[|A|=1\] and the time period \[=\dfrac{2\pi }{B}=\dfrac{2\pi }{1/2}=4\pi \]
That means one cycle of the given wave function will be completed in \[4\pi \].
Now we have the basic idea of how the wave will be but we still need the coordinates so as to plot the graph.
For getting the coordination, we will provide values of \[x=\pi ,2\pi ,3\pi ,4\pi \] and correspondingly we will get the values of y co-ordinate.
Let’s start,
1. When \[x=0\]
\[y=-\cos \left( \dfrac{1}{2}x \right)\]
Putting the value of x in y, we get,
\[\Rightarrow y=-\cos \left( \dfrac{1}{2}x \right)=-\cos ({{0}^{\circ }})=-1\]
The coordinate is \[(0,-1)\]
2. When \[x=\pi \]
Putting the value of x in y, we get,
\[\Rightarrow y=-\cos \left( \dfrac{1}{2}x \right)=-\cos \left( \dfrac{\pi }{2} \right)=0\]
Coordinate is \[(\pi ,0)\]
3. When \[x=2\pi \]
Putting the value of x in y, we get,
\[\Rightarrow y=-\cos \left( \dfrac{1}{2}x \right)=-\cos \left( \dfrac{2\pi }{2} \right)=-\cos (\pi )=-(-1)=1\]
Coordinate is \[(2\pi ,1)\]
4. When \[x=3\pi \]
Putting the value of x in y, we get,
\[\Rightarrow y=-\cos \left( \dfrac{1}{2}x \right)=-\cos \left( \dfrac{3\pi }{2} \right)=-\cos (\pi +\dfrac{\pi }{2})=-(-\cos (\dfrac{\pi }{2}))=0\]
As we know that \[\cos (\pi +\theta )=-\cos \theta \].
Coordinate is \[(3\pi ,0)\]
5. When \[x=4\pi \]
Putting the value of x in y, we get,
\[\Rightarrow y=-\cos \left( \dfrac{1}{2}x \right)=-\cos \left( \dfrac{4\pi }{2} \right)=-\cos (2\pi )=-(1)=-1\]
Coordinate is \[(4\pi ,-1)\]
We have the required coordinates so now we can plot the graph of the function which is as follows:
Note: Comparing the equations for finding the variables in the standard equation of sinusoidal should be done carefully using only the required form of the equation. While finding the coordinates, the coordinates should be written appropriately in the form \[(x,y)\].
Recently Updated Pages
Basicity of sulphurous acid and sulphuric acid are

Master Class 12 Economics: Engaging Questions & Answers for Success
Master Class 12 Biology: Engaging Questions & Answers for Success
Master Class 11 English: Engaging Questions & Answers for Success
Master Class 11 Physics: Engaging Questions & Answers for Success
Master Class 11 Computer Science: Engaging Questions & Answers for Success
Trending doubts
Draw a diagram of a plant cell and label at least eight class 11 biology CBSE
Proton was discovered by A Thomson B Rutherford C Chadwick class 11 chemistry CBSE
What is the purity of pure gold in carat class 11 chemistry CBSE
Can anyone list 10 advantages and disadvantages of friction
Lysosomes are known as suicidal bags of cell why class 11 biology CBSE
Derive the equation of motion by the calculus method class 11 physics CBSE