


How do you sketch $f\left( x,y \right)=\ln \left( {{x}^{2}}+{{y}^{2}} \right)$?
Answer
550.2k+ views
Hint: The equation $f\left( x,y \right)=\ln \left( {{x}^{2}}+{{y}^{2}} \right)$ involves two independent variables, x and y. For sketching it, we need equate the given function to the variable z to get the equation $z=\ln \left( {{x}^{2}}+{{y}^{2}} \right)$. For plotting it, we must first convert it into the polar form by substituting $x=r\cos \theta $ and $y=r\sin \theta $. Then the given equation will get reduced to $z=2\ln \left( r \right)$. Then we have to sketch the two dimensional graph of the equation $z=\ln \left( x \right)$ and finally rotate it about the z-axis. The required graph will be obtained as the surface of revolution.
Complete step by step solution:
The given function is
$f\left( x,y \right)=\ln \left( {{x}^{2}}+{{y}^{2}} \right)$
As can be observed above, that $f$ is a function of the independent variables x and y. So we must have a dependent variable z which must be equated to $f$ to get the equation
$\Rightarrow z=\ln \left( {{x}^{2}}+{{y}^{2}} \right)$
If we substitute $x=r\cos \theta $ and $y=r\sin \theta $ in the above equation, we get
$\begin{align}
& \Rightarrow z=\ln \left( {{\left( r\cos \theta \right)}^{2}}+{{\left( r\sin \theta \right)}^{2}} \right) \\
& \Rightarrow z=\ln \left( {{r}^{2}}{{\cos }^{2}}\theta +{{r}^{2}}{{\sin }^{2}}\theta \right) \\
\end{align}$
Taking ${{r}^{2}}$ common we get
\[\Rightarrow z=\ln \left( {{r}^{2}}\left( {{\cos }^{2}}\theta +{{\sin }^{2}}\theta \right) \right)\]
We know that \[{{\cos }^{2}}\theta +{{\sin }^{2}}\theta =1\]. Substituting this above, we get
\[\Rightarrow z=\ln \left( {{r}^{2}} \right)\]
Now, we know from the properties of logarithm that $\ln \left( {{a}^{m}} \right)=m\ln \left( a \right)$. So the above equation can be written as
\[\Rightarrow z=2\ln \left( r \right)\]
If we replace $r$ by $x$ in the above equation, we will get
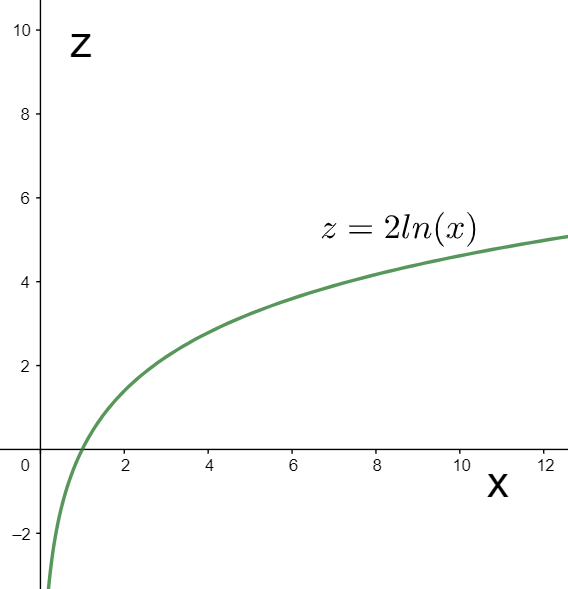
\[\Rightarrow z=2\ln \left( x \right)\]
The graph of the above equation in the X-Z plane can be plotted as
Now, on revolving the above graph about the z-axis, we will obtain the graph of the given function as a surface of revolution as shown below.
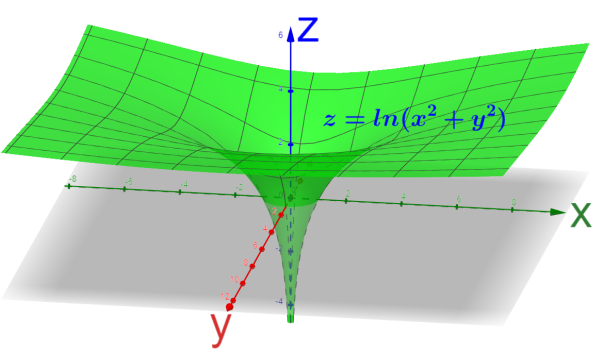
Hence, we have sketched the graph of the given function.
Note: The graph obtained in the above solution, as we can observe, is a three dimensional graph as it involves three variables, namely x, y, and z. These three dimensional graphs cannot be obtained using the simple derivatives and coordinates concepts. To obtain such graphs, we must be familiar with the advanced mathematics concepts such as the solids of revolution etc.
Complete step by step solution:
The given function is
$f\left( x,y \right)=\ln \left( {{x}^{2}}+{{y}^{2}} \right)$
As can be observed above, that $f$ is a function of the independent variables x and y. So we must have a dependent variable z which must be equated to $f$ to get the equation
$\Rightarrow z=\ln \left( {{x}^{2}}+{{y}^{2}} \right)$
If we substitute $x=r\cos \theta $ and $y=r\sin \theta $ in the above equation, we get
$\begin{align}
& \Rightarrow z=\ln \left( {{\left( r\cos \theta \right)}^{2}}+{{\left( r\sin \theta \right)}^{2}} \right) \\
& \Rightarrow z=\ln \left( {{r}^{2}}{{\cos }^{2}}\theta +{{r}^{2}}{{\sin }^{2}}\theta \right) \\
\end{align}$
Taking ${{r}^{2}}$ common we get
\[\Rightarrow z=\ln \left( {{r}^{2}}\left( {{\cos }^{2}}\theta +{{\sin }^{2}}\theta \right) \right)\]
We know that \[{{\cos }^{2}}\theta +{{\sin }^{2}}\theta =1\]. Substituting this above, we get
\[\Rightarrow z=\ln \left( {{r}^{2}} \right)\]
Now, we know from the properties of logarithm that $\ln \left( {{a}^{m}} \right)=m\ln \left( a \right)$. So the above equation can be written as
\[\Rightarrow z=2\ln \left( r \right)\]
If we replace $r$ by $x$ in the above equation, we will get
\[\Rightarrow z=2\ln \left( x \right)\]
The graph of the above equation in the X-Z plane can be plotted as
Now, on revolving the above graph about the z-axis, we will obtain the graph of the given function as a surface of revolution as shown below.
Hence, we have sketched the graph of the given function.
Note: The graph obtained in the above solution, as we can observe, is a three dimensional graph as it involves three variables, namely x, y, and z. These three dimensional graphs cannot be obtained using the simple derivatives and coordinates concepts. To obtain such graphs, we must be familiar with the advanced mathematics concepts such as the solids of revolution etc.
Recently Updated Pages
Master Class 12 Economics: Engaging Questions & Answers for Success
Master Class 12 Physics: Engaging Questions & Answers for Success
Master Class 12 English: Engaging Questions & Answers for Success
Master Class 12 Social Science: Engaging Questions & Answers for Success
Master Class 12 Maths: Engaging Questions & Answers for Success
Master Class 12 Business Studies: Engaging Questions & Answers for Success
Trending doubts
Which are the Top 10 Largest Countries of the World?
What are the major means of transport Explain each class 12 social science CBSE
Draw a labelled sketch of the human eye class 12 physics CBSE
Why cannot DNA pass through cell membranes class 12 biology CBSE
Differentiate between insitu conservation and exsitu class 12 biology CBSE
Draw a neat and well labeled diagram of TS of ovary class 12 biology CBSE