


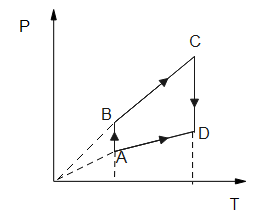
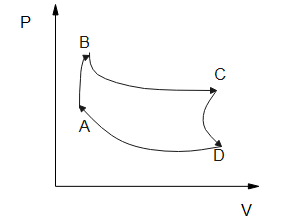
Pressure versus temperature graph for an ideal gas is as shown in the figure.
Corresponding density (ρ) versus volume (v) graph will be
A)
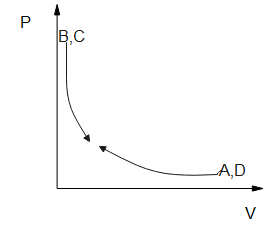
B)
C)
D)
Answer
606.6k+ views
Hint: First we plot the corresponding density v/s pressure graph it makes to draw the corresponding density v/s volume graph. By considering Boyle's law which states that the pressure (P) of a given quantity of gas varies inversely with its volume denoted as V at a constant temperature.
Complete Step by step solution:
First, we have to observe a given graph which is pressure v/s temperature.

First, we have to plot, Corresponding density versus pressure graph to draw the corresponding density v/s volume graph.
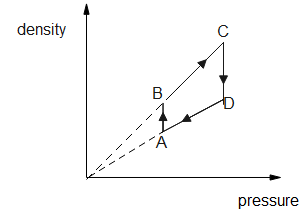
Let’s consider Boyle's law which simply states that the pressure (P) of a given quantity of gas varies inversely with its volume denoted as V at an express constant temperature. We can express it in the mathematical form $P \propto \dfrac{1}{V}$ at T is constant.
So, we can draw the density v/s volume graph as
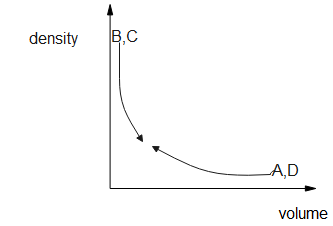
Hence, the option B is the correct answer.
Additional information:
Boyle law state that the volume of a sample of a gas is inversely proportional to its pressure, Charles and Gay-Lussac is demonstrated that the volume of a gas is directly proportional to its temperature (in kelvins) at constant pressure.
Here Boyle's law is used to predict the result of introducing a change in volume and pressure only and to the initial state of a fixed quantity of gas.
Note:
We know that gas can work against excessive ambient pressure by extending or compressing it , work done is often referred to as the amount of pressure-volume or PV when the volume of gas is increased. The ideal gas equation is also known as the equation of the states because this equation uses the variables in it to determine or we can explain the state of the gas that is considered.
Complete Step by step solution:
First, we have to observe a given graph which is pressure v/s temperature.
First, we have to plot, Corresponding density versus pressure graph to draw the corresponding density v/s volume graph.
Let’s consider Boyle's law which simply states that the pressure (P) of a given quantity of gas varies inversely with its volume denoted as V at an express constant temperature. We can express it in the mathematical form $P \propto \dfrac{1}{V}$ at T is constant.
So, we can draw the density v/s volume graph as
Hence, the option B is the correct answer.
Additional information:
Boyle law state that the volume of a sample of a gas is inversely proportional to its pressure, Charles and Gay-Lussac is demonstrated that the volume of a gas is directly proportional to its temperature (in kelvins) at constant pressure.
Here Boyle's law is used to predict the result of introducing a change in volume and pressure only and to the initial state of a fixed quantity of gas.
Note:
We know that gas can work against excessive ambient pressure by extending or compressing it , work done is often referred to as the amount of pressure-volume or PV when the volume of gas is increased. The ideal gas equation is also known as the equation of the states because this equation uses the variables in it to determine or we can explain the state of the gas that is considered.
Recently Updated Pages
Master Class 12 Business Studies: Engaging Questions & Answers for Success
Master Class 12 Chemistry: Engaging Questions & Answers for Success
Master Class 12 Biology: Engaging Questions & Answers for Success
Class 12 Question and Answer - Your Ultimate Solutions Guide
Master Class 11 English: Engaging Questions & Answers for Success
Master Class 11 Social Science: Engaging Questions & Answers for Success
Trending doubts
Which are the Top 10 Largest Countries of the World?
Draw a labelled sketch of the human eye class 12 physics CBSE
Differentiate between homogeneous and heterogeneous class 12 chemistry CBSE
Differentiate between Pyramid of energy and pyramid class 12 biology CBSE
Why is the cell called the structural and functional class 12 biology CBSE
Draw the diagram of the pyramid of energy Explain In class 12 biology CBSE