


How do you plot \[A\left( {4, - 1} \right)\] , \[B\left( {5,0} \right)\] ?
Answer
551.7k+ views
Hint: Here in this question, we have to plot the graph for the given points. Here we have a value of x axis and y axis. They have given only one value of x and y. Hence by considering the points we plot the graph for the given question. hence the solution or graph is obtained for the given question.
Complete step by step solution:
Here in this question, we have to plot the graph for the given function. A graph of a function is a set of ordered pairs and it is represented as \[y = f(x)\] , where x and f(x) are real numbers. These pairs are in the form of cartesian form and the graph is the two-dimensional graph.
Here we have a point, usually the point is generally represented as \[(x,y)\] . The first term represents the x value and the second term represents the y value.
Here we have to plot the graph for the points \[A\left( {4, - 1} \right)\] and \[B\left( {5,0} \right)\] .
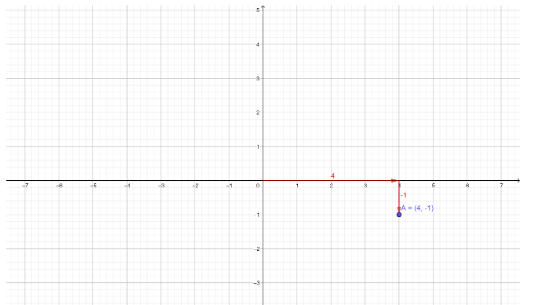
In \[A\left( {4, - 1} \right)\] when the x value is \[4\] , then the value of y is \[ - 1\] . The line of a graph will be parallel to the y axis. From the origin of a graph we have to move \[4\] step right side along x-axis and then \[ - 1\] steps move downwards along y-axis from when x point is located.
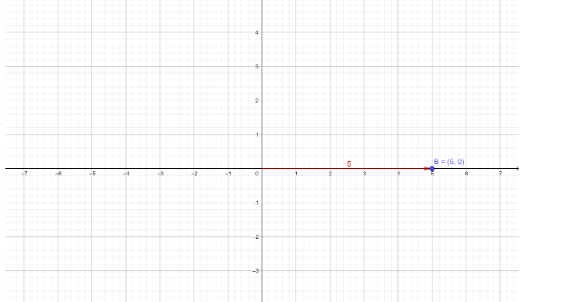
In \[B\left( {5,0} \right)\] when the x value is \[5\] , then the value of y is \[0\] . The line of a graph will be parallel to the y axis. From the origin of a graph we have to move \[5\] step right side along x-axis and then y value is \[0\] so no need to move along y-axis.
Therefore, the graph for the point \[A\left( {4, - 1} \right)\] is plotted as shown below:
Therefore, the graph for the point \[B\left( {5,0} \right)\] is plotted as shown below:
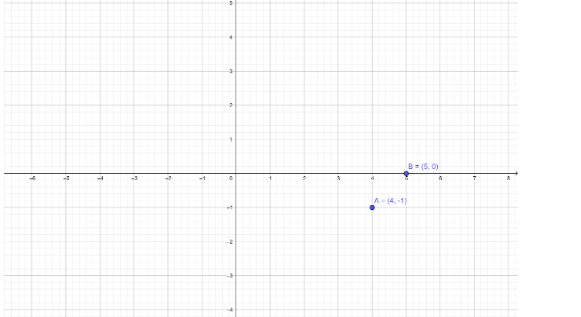
The line represents the direction of movement.
When we locate two points \[A\left( {4, - 1} \right)\] and \[B\left( {5,0} \right)\] in a single graph as shown below.
Note: The graph is plotted x-axis versus y axis. The graph is two dimensional. By the equation of a graph, we can plot the graph by assuming the value of x. we can’t assume the value of y. because the value of y depends on the value of x. Hence, we have plotted the graph.
Complete step by step solution:
Here in this question, we have to plot the graph for the given function. A graph of a function is a set of ordered pairs and it is represented as \[y = f(x)\] , where x and f(x) are real numbers. These pairs are in the form of cartesian form and the graph is the two-dimensional graph.
Here we have a point, usually the point is generally represented as \[(x,y)\] . The first term represents the x value and the second term represents the y value.
Here we have to plot the graph for the points \[A\left( {4, - 1} \right)\] and \[B\left( {5,0} \right)\] .
In \[A\left( {4, - 1} \right)\] when the x value is \[4\] , then the value of y is \[ - 1\] . The line of a graph will be parallel to the y axis. From the origin of a graph we have to move \[4\] step right side along x-axis and then \[ - 1\] steps move downwards along y-axis from when x point is located.
In \[B\left( {5,0} \right)\] when the x value is \[5\] , then the value of y is \[0\] . The line of a graph will be parallel to the y axis. From the origin of a graph we have to move \[5\] step right side along x-axis and then y value is \[0\] so no need to move along y-axis.
Therefore, the graph for the point \[A\left( {4, - 1} \right)\] is plotted as shown below:
Therefore, the graph for the point \[B\left( {5,0} \right)\] is plotted as shown below:
The line represents the direction of movement.
When we locate two points \[A\left( {4, - 1} \right)\] and \[B\left( {5,0} \right)\] in a single graph as shown below.
Note: The graph is plotted x-axis versus y axis. The graph is two dimensional. By the equation of a graph, we can plot the graph by assuming the value of x. we can’t assume the value of y. because the value of y depends on the value of x. Hence, we have plotted the graph.

Recently Updated Pages
Master Class 8 Social Science: Engaging Questions & Answers for Success
Master Class 8 Science: Engaging Questions & Answers for Success
Master Class 8 Maths: Engaging Questions & Answers for Success
Class 8 Question and Answer - Your Ultimate Solutions Guide
Master Class 9 Social Science: Engaging Questions & Answers for Success
Master Class 9 Science: Engaging Questions & Answers for Success
Trending doubts
What are gulf countries and why they are called Gulf class 8 social science CBSE
What is BLO What is the full form of BLO class 8 social science CBSE
Citizens of India can vote at the age of A 18 years class 8 social science CBSE
Advantages and disadvantages of science
Full form of STD, ISD and PCO
Give me the opposite gender of Duck class 8 english CBSE