


How do you plot (1, -4) on the coordinate plane?
Answer
587.7k+ views
Hint: This question requires basic plotting rules in graphing. We take the distance from the x-axis and similarly we take the distance from the y-axis and plot the given point of (1, -4).
Complete step by step solution:
A graph in general is used for plotting points or curves in the coordinate plane. The coordinate axis is divided into 4 quadrants by the intersecting x-axis and y-axis. The quadrants are numbered from 1-4 in the anti-clockwise direction starting from the top right quadrant. Below is the figure that shows these quadrants.
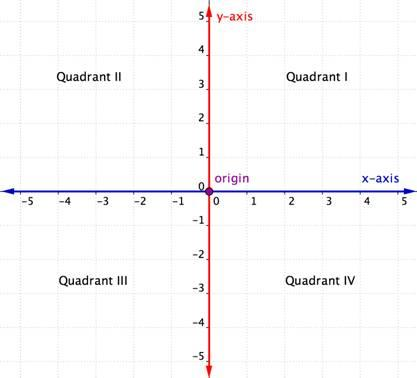
In the first quadrant, both x and y values are positive.
In the second quadrant, y values are positive whereas x values are negative.
In the third quadrant, both x and y values are negative.
In the fourth quadrant, x values are positive whereas y values are negative.
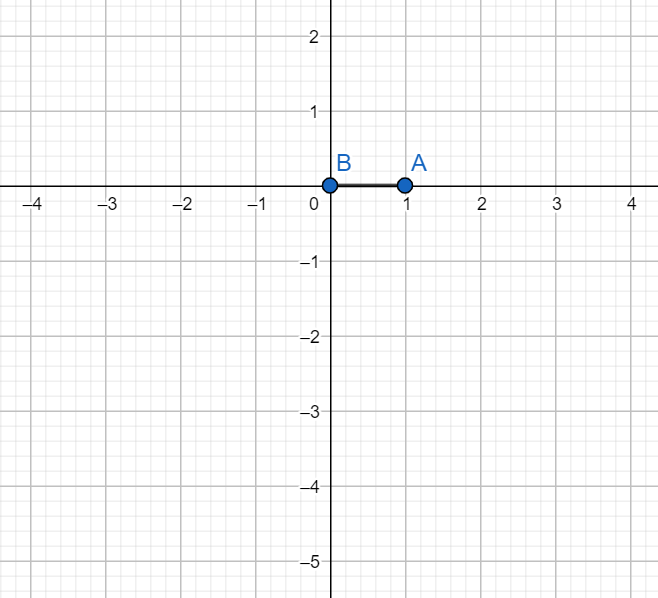
Now to plot the point (1, -4) we need to see which quadrant the point lies in. Since the y value is negative and x value is positive, we can say that it lies in the fourth quadrant.
The x value 1 unit represents the distance of 1 unit along the x-axis from the y-axis.
Similarly, the y value -4 represents the distance of 4 units along the y-axis from the x-axis.
To plot the point, we start at the origin(B) and move 1 unit to the right along the x-axis to a point A.
Next we move from point A, 4 units down (since the point lies in the fourth quadrant).
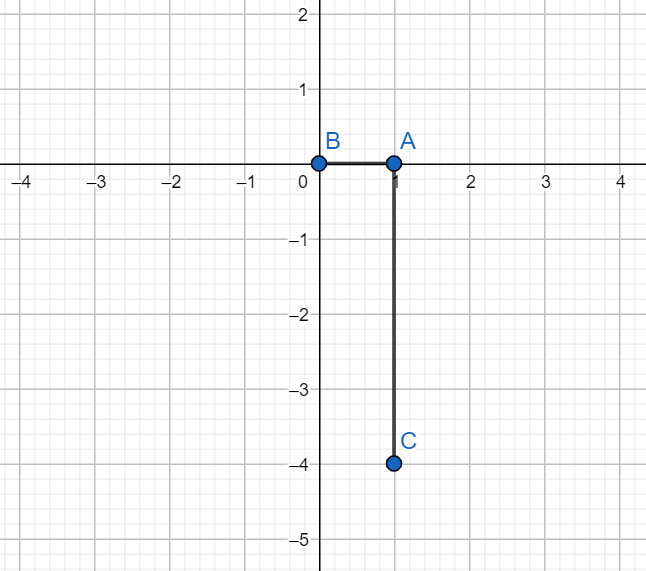
This point C represents the location of the point (1, -4).
Hence, we have plotted the point (1, -4) on the coordinate axis.
Note: We can solve this by also considering a straight line (parallel to the y-axis) through the point (1, 0) on the x-axis and similarly a straight line (parallel to the x-axis) through the point (0, -4) on the y-axis. The intersection point of these 2 lines gives us the desired plot of the point (1, -4).
Complete step by step solution:
A graph in general is used for plotting points or curves in the coordinate plane. The coordinate axis is divided into 4 quadrants by the intersecting x-axis and y-axis. The quadrants are numbered from 1-4 in the anti-clockwise direction starting from the top right quadrant. Below is the figure that shows these quadrants.
In the first quadrant, both x and y values are positive.
In the second quadrant, y values are positive whereas x values are negative.
In the third quadrant, both x and y values are negative.
In the fourth quadrant, x values are positive whereas y values are negative.
Now to plot the point (1, -4) we need to see which quadrant the point lies in. Since the y value is negative and x value is positive, we can say that it lies in the fourth quadrant.
The x value 1 unit represents the distance of 1 unit along the x-axis from the y-axis.
Similarly, the y value -4 represents the distance of 4 units along the y-axis from the x-axis.
To plot the point, we start at the origin(B) and move 1 unit to the right along the x-axis to a point A.
Next we move from point A, 4 units down (since the point lies in the fourth quadrant).
This point C represents the location of the point (1, -4).
Hence, we have plotted the point (1, -4) on the coordinate axis.
Note: We can solve this by also considering a straight line (parallel to the y-axis) through the point (1, 0) on the x-axis and similarly a straight line (parallel to the x-axis) through the point (0, -4) on the y-axis. The intersection point of these 2 lines gives us the desired plot of the point (1, -4).
Recently Updated Pages
Master Class 12 Economics: Engaging Questions & Answers for Success
Master Class 12 Biology: Engaging Questions & Answers for Success
Master Class 11 English: Engaging Questions & Answers for Success
Master Class 11 Physics: Engaging Questions & Answers for Success
Master Class 11 Computer Science: Engaging Questions & Answers for Success
Master Class 11 Chemistry: Engaging Questions & Answers for Success
Trending doubts