


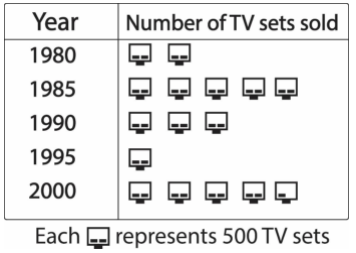
Number of TV sets sold in the year 1995 is
A. 1000
B. 500
C. 50
D. 2000
Answer
551.4k+ views
Hint: We are given that each TV symbol represents 500 TV sets. Hence we need to check the number of symbols corresponding to the given year and multiply it with 500 to get the total number of TV sets sold in that particular year.
Step by step solution :
At first lets study the given pictograph

It is clearly given that each tv symbol represents 500 TVs.
Which means that the number of TV sets in a particular year can be given given by multiplying 500 with the number of TV images corresponding to that particular year
Now we are asked about the number of TV sets sold in the year 995.
By studying the pictograph we can see that there is only one TV symbol corresponding to the year 1995.
Hence now multiplying 500 by 1 we get 500.
Hence the number of TV sets sold in the year 1995 is 500.
Therefore the correct answer is option B.
Note:
1) A pictograph is a small drawing. Today, pictograms are used very often. Because they are independent of the language, they are often used where there are people who need to understand things, even if they do not read or speak the language.
2) A pictograph uses picture symbols to convey the meaning of statistical information. Pictographs should be used carefully because the graphs may, either accidentally or deliberately, misrepresent the data. This is why a graph should be visually accurate.
Step by step solution :
At first lets study the given pictograph
It is clearly given that each tv symbol represents 500 TVs.
Which means that the number of TV sets in a particular year can be given given by multiplying 500 with the number of TV images corresponding to that particular year
Now we are asked about the number of TV sets sold in the year 995.
By studying the pictograph we can see that there is only one TV symbol corresponding to the year 1995.
Hence now multiplying 500 by 1 we get 500.
Hence the number of TV sets sold in the year 1995 is 500.
Therefore the correct answer is option B.
Note:
1) A pictograph is a small drawing. Today, pictograms are used very often. Because they are independent of the language, they are often used where there are people who need to understand things, even if they do not read or speak the language.
2) A pictograph uses picture symbols to convey the meaning of statistical information. Pictographs should be used carefully because the graphs may, either accidentally or deliberately, misrepresent the data. This is why a graph should be visually accurate.
Recently Updated Pages
Master Class 9 General Knowledge: Engaging Questions & Answers for Success
Master Class 9 Social Science: Engaging Questions & Answers for Success
Master Class 9 English: Engaging Questions & Answers for Success
Master Class 9 Maths: Engaging Questions & Answers for Success
Master Class 9 Science: Engaging Questions & Answers for Success
Class 9 Question and Answer - Your Ultimate Solutions Guide
Trending doubts
Who is eligible for RTE class 9 social science CBSE
What is the Full Form of ISI and RAW
How do you find the valency of chlorine sulphur and class 9 chemistry CBSE
What are the major achievements of the UNO class 9 social science CBSE
Explain the importance of pH in everyday life class 9 chemistry CBSE
Differentiate between parenchyma collenchyma and sclerenchyma class 9 biology CBSE