


Maximum number of teachers are in the age group?

(A) $45 - 50$
(B) $25 - 30$
(C) $40 - 45$
(D) $30 - 35$
Answer
542.7k+ views
Hint: The given questions revolve around the concepts of data handling tools such as histogram. A histogram is a way of representing a data set in the form of a graph using bars of different heights. One must know how to read a histogram and convert it into a table consisting of all the relevant information required to answer the questions.
Complete step by step solution:
So, in the given question, we are provided with a histogram as shown below.
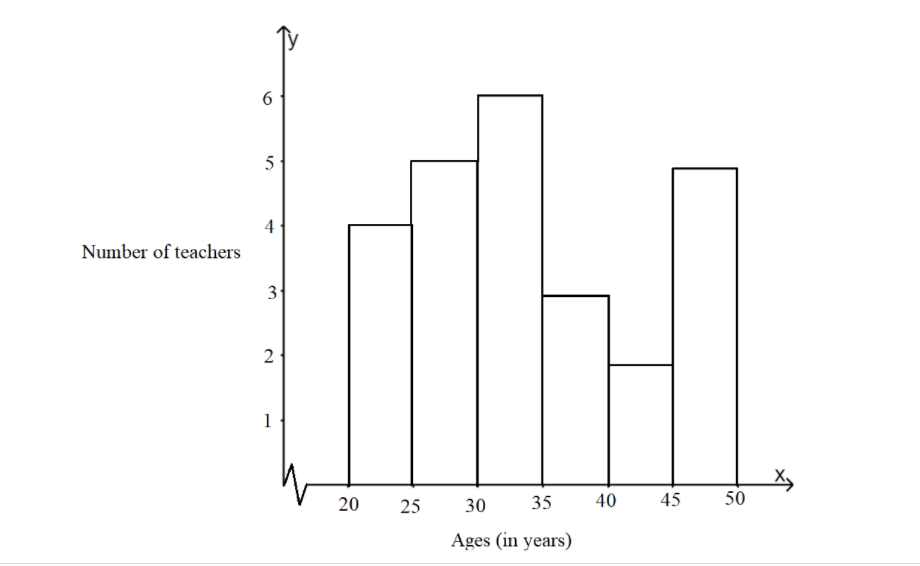
The given histogram represents the number of teachers in different age groups or intervals of $5$ years. Now, we have to find the interval of the age group which consists of the maximum number of teachers.
So, we create a table consisting of all the data represented in the histogram given. So, it shows the number of teachers in every age group in a tabular format. So, we get,
Now, we can easily find the age group which consists of the maximum number of teachers by looking at the table.
So, the age group $30 - 35$ has the maximum number of teachers.
Hence, option (D) is correct.
So, the correct answer is “Option D”.
Note: One must know how to read bar graphs and histograms correctly as the given questions tests the ability to do so. We must form a table of values with the help of the given histogram carefully with patience to ensure that the final answer to the problem is correct. We also must be aware of the scale which is used in a histogram before solving such problems as it affects the final answer to a great extent.
Complete step by step solution:
So, in the given question, we are provided with a histogram as shown below.
The given histogram represents the number of teachers in different age groups or intervals of $5$ years. Now, we have to find the interval of the age group which consists of the maximum number of teachers.
So, we create a table consisting of all the data represented in the histogram given. So, it shows the number of teachers in every age group in a tabular format. So, we get,
| Age (in years) | Number of teachers |
| $20 - 25$ | $4$ |
| $25 - 30$ | $5$ |
| $30 - 35$ | $6$ |
| $35 - 40$ | $3$ |
| $40 - 45$ | $2$ |
| $45 - 50$ | $5$ |
Now, we can easily find the age group which consists of the maximum number of teachers by looking at the table.
So, the age group $30 - 35$ has the maximum number of teachers.
Hence, option (D) is correct.
So, the correct answer is “Option D”.
Note: One must know how to read bar graphs and histograms correctly as the given questions tests the ability to do so. We must form a table of values with the help of the given histogram carefully with patience to ensure that the final answer to the problem is correct. We also must be aware of the scale which is used in a histogram before solving such problems as it affects the final answer to a great extent.

Recently Updated Pages
Master Class 12 Business Studies: Engaging Questions & Answers for Success
Master Class 12 Biology: Engaging Questions & Answers for Success
Master Class 12 Chemistry: Engaging Questions & Answers for Success
Class 12 Question and Answer - Your Ultimate Solutions Guide
Master Class 11 Social Science: Engaging Questions & Answers for Success
Master Class 11 English: Engaging Questions & Answers for Success
Trending doubts
What is the Full Form of ICSE / ISC ?
Fill the blanks with the suitable prepositions 1 The class 9 english CBSE
Difference Between Plant Cell and Animal Cell
How many hours before the closure of election must class 9 social science CBSE
What is pollution? How many types of pollution? Define it
Name 10 Living and Non living things class 9 biology CBSE