


Match the following area under the given curves and given lines in column I with their corresponding values in column II and choose the correct option from the codes below.
Column I Column II A. \[y={{x}^{2}}\], \[x=1\], \[x=2\] and x-axis 1. \[\dfrac{3124}{5}\] sq units B. \[y={{x}^{4}}\], \[x=1\], \[x=5\] and x-axis 2. \[\dfrac{1}{6}\] sq units C. \[y=x\] and \[y={{x}^{2}}\] 3. 4 sq units D. \[y=\sin x\],\[x=0\] and \[x=2\pi \] 4. \[\dfrac{7}{3}\] sq units
| Column I | Column II |
| A. \[y={{x}^{2}}\], \[x=1\], \[x=2\] and x-axis | 1. \[\dfrac{3124}{5}\] sq units |
| B. \[y={{x}^{4}}\], \[x=1\], \[x=5\] and x-axis | 2. \[\dfrac{1}{6}\] sq units |
| C. \[y=x\] and \[y={{x}^{2}}\] | 3. 4 sq units |
| D. \[y=\sin x\],\[x=0\] and \[x=2\pi \] | 4. \[\dfrac{7}{3}\] sq units |
Answer
618.6k+ views
Hint: Draw the diagrams showing all the curves and bounded areas with them in each case. Integration of a function f(x) with x-axis from x = a to x = b is \[\int\limits_{a}^{b}{f(x)dx}\]. Use the relation given as \[\int\limits_{a}^{b}{{{x}^{n}}dx}=\dfrac{{{x}^{n+1}}}{n+1},\int{\sin x dx=-\cos x}\].
Complete step by step answer:
So we need to find the area bounded by the curves given in each row of column 1 and hence, we need to match with the corresponding area in column 2.
A. \[y={{x}^{2}}\], \[x=1\], \[x=2\] and x-axis
Here, the straight lines x = 1 and x = 2 will be parallel to the y-axis and will pass through (1, 0) and (2, 0) respectively. The curve \[y={{x}^{2}}\] is representing a parabola, which will be symmetrical about y-axis and it can be compared with the standard equation of parabola, i.e. \[{{x}^{2}}=4ay\].
So let us draw curves on the coordinate plane.
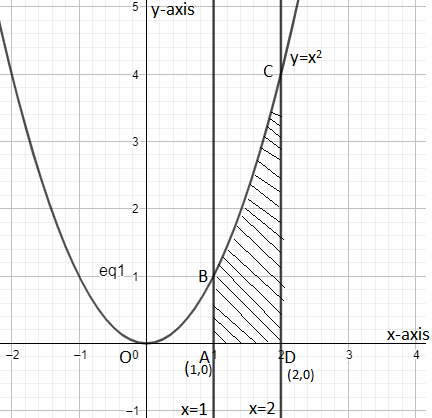
So the shaded region in the above diagram is the area bounded by the curves x = 1, x = 2, \[y={{x}^{2}}\] and x-axis. It can be calculated by integrating \[y={{x}^{2}}\] from x = 1 to x = 2.
So we get an area of shaded region \[\int\limits_{1}^{2}{{{x}^{2}}dx}\].
We know \[\int\limits_{a}^{b}{{{x}^{n}}dx}=\dfrac{{{x}^{n+1}}}{n+1}\]. Hence we can solve the above integration as,
Area of the shaded region \[=\int\limits_{1}^{2}{{{x}^{2}}dx}=\left( \dfrac{{{x}^{3}}}{3} \right)_{1}^{2}=\left( \dfrac{{{\left( 2 \right)}^{3}}}{3}-\dfrac{{{\left( 1 \right)}^{3}}}{3} \right)=\dfrac{8}{3}-\dfrac{1}{3}=\dfrac{7}{3}uni{{t}^{2}}\].
Hence the area of the shaded region is \[\dfrac{7}{3}uni{{t}^{2}}\].
So, row A. \[y={{x}^{2}}\], \[x=1\], \[x=2\] and x-axis in column I will match to 4. \[\dfrac{7}{3}\] sq units of column II.
B. \[y={{x}^{4}}\], \[x=1\], \[x=5\] and x-axis
As the lines \[x=1\] and \[x=5\] will be parallel to y-axis and will pass through points (1, 0) and (5, 0) respectively on x-axis and the curve \[y={{x}^{4}}\] which is symmetric with y-axis; similarly \[y={{x}^{4}}\] will be symmetric to y-axis as well because value of x of same magnitude. In other words \[y={{x}^{4}}\] is an even function, i.e. \[f(x)=f(-x)\left[ {{\left( x \right)}^{4}}={{\left( -x \right)}^{4}} \right]\] and \[y={{x}^{4}}\] will pass through (0, 0) and will tend to \[\infty \] when \[x\to \infty \] and tend to \[\infty \] when \[x\to -\infty \]. So we can give diagram with curves as,
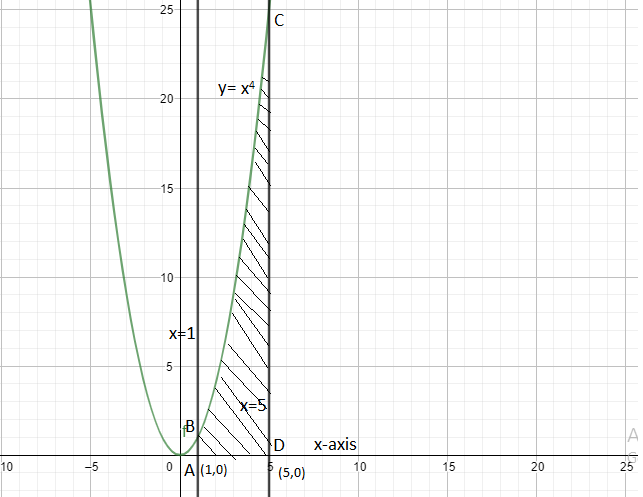
Hence we can calculate the area of the shaded region by integrating \[y={{x}^{4}}\] from x = 1 to x = 5.
So we get,
Area of shaded region \[=\int\limits_{1}^{5}{{{x}^{4}}dx}=\left( \dfrac{{{x}^{5}}}{5} \right)_{1}^{5}=\dfrac{{{\left( 5 \right)}^{5}}}{5}-\dfrac{1}{5}=\dfrac{3125}{5}\] square units.
So area of shaded region = \[\dfrac{3125}{5}\] sq units.
Hence, B. \[y={{x}^{4}}\], \[x=1\], \[x=5\] and x-axis will match to 1. \[\dfrac{3124}{5}\] sq units in column II.
C. \[y=x\] and \[y={{x}^{2}}\]
As y = x is a line which will pass through origin and has slope of 1 (by comparing it to y = mx + c) and the curve \[y={{x}^{2}}\] is representing a parabola of type \[{{x}^{4}}=4ay\] which is symmetric about y-axis and vertex of it is (0, 0). Hence we can draw the diagram as,
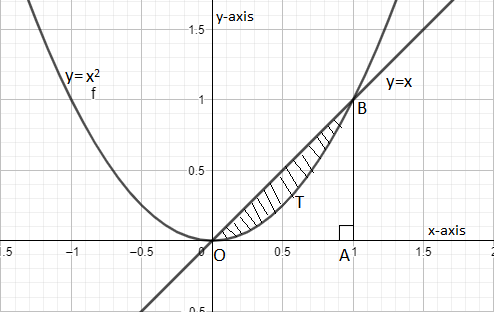
As we can observe the area bounded between y = x and \[y={{x}^{2}}\]. So area of shaded region i.e. OBTO can be given by the difference of the area of \[\Delta OBA\] and the area formed by the parabola \[y={{x}^{2}}\] with x-axis in the first quadrant from point O to A i.e. area of region at OTBAO.
So let us calculate point B i.e. the intersection point of parabola \[y={{x}^{2}}\] and y =x.
We have y = x and \[y={{x}^{2}}\].
Put the value of y from the equation y = x to the equation of parabola i.e. \[y={{x}^{2}}\]. So we get,
\[\begin{align}
& x={{x}^{2}} \\
& {{x}^{2}}-x=0 \\
& x(x-1)=0 \\
\end{align}\]
\[x=0\] or \[x=1\].
Now we can get corresponding values of y from the equation y = x by putting x = 0 and x = 1 to it. So we get,
x = 0, y = 0 and x = 1, y = 1.
As point B cannot be (0, 0), from the diagram, hence point B is (1, 1) and the equation of the line segment AB is x =1, and length of AB is 1 as well because y-coordinate of B is 1.
Hence we get area of shaded region as,
Area of shaded region = area of \[\Delta OBA\] - area of curve OTBAO
We know, area of a triangle \[=\dfrac{1}{2}\times base\times height\]
So area of \[\Delta OBA=\dfrac{1}{2}\times OA\times OB=\dfrac{1}{2}\times 1\times 1=\dfrac{1}{2}\] sq units.
Area of the curve OTBAO can be calculated by integrating \[y={{x}^{2}}\] from x = 0 to x = 1.
So we get,
Area of OTBAO \[=\int\limits_{0}^{1}{{{x}^{2}}dx}=\left( \dfrac{{{x}^{3}}}{3} \right)_{0}^{1}=\dfrac{1}{3}-0=\dfrac{1}{3}\] sq units.
Hence area of shaded region \[=\dfrac{1}{2}-\dfrac{1}{3}=\dfrac{3-2}{6}=\dfrac{1}{6}\] sq units.
Hence, C. \[y=x\] and \[y={{x}^{2}}\] will match to 2. \[\dfrac{1}{6}\] sq units in column II.
D. \[y=\sin x\],\[x=0\] and \[x=2\pi \]
Let us represent the graph of \[y=\sin x\] from \[x=0\] to \[x=2\pi \].
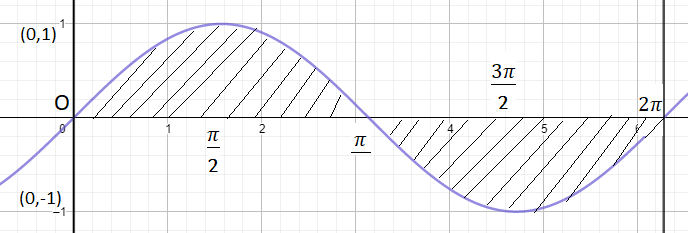
As we need to find the area from x = 0 to \[x=2\pi \] in the curve of \[y=\sin x\]. We can observe that the area of the curve \[y=\sin x\] from x = 0 to \[x=\pi \] and \[x=\pi \] to \[x=2\pi \] will be equal by the symmetric curve of it.
Hence the area of the shaded region can be calculated as the two lines of the area of \[y=\sin x\] from x = 0 and \[x=\pi \].
Hence we get,
Area of shaded region \[=2\int\limits_{0}^{\pi }{\sin xdx}=2\left( -\cos x \right)_{0}^{\pi }=2\left( -\cos \pi -\left( -cos0 \right) \right)=2\left( 1+1 \right)=4\] sq units
where we used relation \[\int{\sin x dx=-\cos x}\].
Hence, D. \[y=\sin x\],\[x=0\] and \[x=2\pi \] will match to 3. 4 sq units of column II.
So we get the answer as,
\[\begin{align}
& A\to 4 \\
& B\to 1 \\
& C\to 2 \\
& D\to 3 \\
\end{align}\]
Note:
Draw the diagram very clearly so that one can easily observe the bounded area by the given curves. We don’t need to be confused with the graph of \[y={{x}^{4}}\]. It will just be similar to the curve \[y={{x}^{2}}\], as both are symmetric about y-axis because both are even functions. So don’t confuse it with the graph of it.
One may find the areas of all the given bounded regions w.r.t. ‘dy’ as well.
One may go wrong with the last part as he/she may integrate sinx from o to \[2\pi \] and gets area as 0.
\[\int\limits_{0}^{2\pi }{\sin x}=\left( -\cos x \right)_{0}^{2\pi }=-\left( \cos 2\pi -\cos 0 \right)=-0=0\].
It is happening because the area is a positive value and we will get the area of sinx from \[\pi \] to \[2\pi \] as ‘-2’ and area of sinx from 0 to \[\pi \] as 2. So we need to take the positive value of \[\int\limits_{0}^{2\pi }{\sin x}dx\] i.e. the positive of ‘-2’ is 2. So it can be a major mistake by the students.
Complete step by step answer:
So we need to find the area bounded by the curves given in each row of column 1 and hence, we need to match with the corresponding area in column 2.
A. \[y={{x}^{2}}\], \[x=1\], \[x=2\] and x-axis
Here, the straight lines x = 1 and x = 2 will be parallel to the y-axis and will pass through (1, 0) and (2, 0) respectively. The curve \[y={{x}^{2}}\] is representing a parabola, which will be symmetrical about y-axis and it can be compared with the standard equation of parabola, i.e. \[{{x}^{2}}=4ay\].
So let us draw curves on the coordinate plane.
So the shaded region in the above diagram is the area bounded by the curves x = 1, x = 2, \[y={{x}^{2}}\] and x-axis. It can be calculated by integrating \[y={{x}^{2}}\] from x = 1 to x = 2.
So we get an area of shaded region \[\int\limits_{1}^{2}{{{x}^{2}}dx}\].
We know \[\int\limits_{a}^{b}{{{x}^{n}}dx}=\dfrac{{{x}^{n+1}}}{n+1}\]. Hence we can solve the above integration as,
Area of the shaded region \[=\int\limits_{1}^{2}{{{x}^{2}}dx}=\left( \dfrac{{{x}^{3}}}{3} \right)_{1}^{2}=\left( \dfrac{{{\left( 2 \right)}^{3}}}{3}-\dfrac{{{\left( 1 \right)}^{3}}}{3} \right)=\dfrac{8}{3}-\dfrac{1}{3}=\dfrac{7}{3}uni{{t}^{2}}\].
Hence the area of the shaded region is \[\dfrac{7}{3}uni{{t}^{2}}\].
So, row A. \[y={{x}^{2}}\], \[x=1\], \[x=2\] and x-axis in column I will match to 4. \[\dfrac{7}{3}\] sq units of column II.
B. \[y={{x}^{4}}\], \[x=1\], \[x=5\] and x-axis
As the lines \[x=1\] and \[x=5\] will be parallel to y-axis and will pass through points (1, 0) and (5, 0) respectively on x-axis and the curve \[y={{x}^{4}}\] which is symmetric with y-axis; similarly \[y={{x}^{4}}\] will be symmetric to y-axis as well because value of x of same magnitude. In other words \[y={{x}^{4}}\] is an even function, i.e. \[f(x)=f(-x)\left[ {{\left( x \right)}^{4}}={{\left( -x \right)}^{4}} \right]\] and \[y={{x}^{4}}\] will pass through (0, 0) and will tend to \[\infty \] when \[x\to \infty \] and tend to \[\infty \] when \[x\to -\infty \]. So we can give diagram with curves as,
Hence we can calculate the area of the shaded region by integrating \[y={{x}^{4}}\] from x = 1 to x = 5.
So we get,
Area of shaded region \[=\int\limits_{1}^{5}{{{x}^{4}}dx}=\left( \dfrac{{{x}^{5}}}{5} \right)_{1}^{5}=\dfrac{{{\left( 5 \right)}^{5}}}{5}-\dfrac{1}{5}=\dfrac{3125}{5}\] square units.
So area of shaded region = \[\dfrac{3125}{5}\] sq units.
Hence, B. \[y={{x}^{4}}\], \[x=1\], \[x=5\] and x-axis will match to 1. \[\dfrac{3124}{5}\] sq units in column II.
C. \[y=x\] and \[y={{x}^{2}}\]
As y = x is a line which will pass through origin and has slope of 1 (by comparing it to y = mx + c) and the curve \[y={{x}^{2}}\] is representing a parabola of type \[{{x}^{4}}=4ay\] which is symmetric about y-axis and vertex of it is (0, 0). Hence we can draw the diagram as,
As we can observe the area bounded between y = x and \[y={{x}^{2}}\]. So area of shaded region i.e. OBTO can be given by the difference of the area of \[\Delta OBA\] and the area formed by the parabola \[y={{x}^{2}}\] with x-axis in the first quadrant from point O to A i.e. area of region at OTBAO.
So let us calculate point B i.e. the intersection point of parabola \[y={{x}^{2}}\] and y =x.
We have y = x and \[y={{x}^{2}}\].
Put the value of y from the equation y = x to the equation of parabola i.e. \[y={{x}^{2}}\]. So we get,
\[\begin{align}
& x={{x}^{2}} \\
& {{x}^{2}}-x=0 \\
& x(x-1)=0 \\
\end{align}\]
\[x=0\] or \[x=1\].
Now we can get corresponding values of y from the equation y = x by putting x = 0 and x = 1 to it. So we get,
x = 0, y = 0 and x = 1, y = 1.
As point B cannot be (0, 0), from the diagram, hence point B is (1, 1) and the equation of the line segment AB is x =1, and length of AB is 1 as well because y-coordinate of B is 1.
Hence we get area of shaded region as,
Area of shaded region = area of \[\Delta OBA\] - area of curve OTBAO
We know, area of a triangle \[=\dfrac{1}{2}\times base\times height\]
So area of \[\Delta OBA=\dfrac{1}{2}\times OA\times OB=\dfrac{1}{2}\times 1\times 1=\dfrac{1}{2}\] sq units.
Area of the curve OTBAO can be calculated by integrating \[y={{x}^{2}}\] from x = 0 to x = 1.
So we get,
Area of OTBAO \[=\int\limits_{0}^{1}{{{x}^{2}}dx}=\left( \dfrac{{{x}^{3}}}{3} \right)_{0}^{1}=\dfrac{1}{3}-0=\dfrac{1}{3}\] sq units.
Hence area of shaded region \[=\dfrac{1}{2}-\dfrac{1}{3}=\dfrac{3-2}{6}=\dfrac{1}{6}\] sq units.
Hence, C. \[y=x\] and \[y={{x}^{2}}\] will match to 2. \[\dfrac{1}{6}\] sq units in column II.
D. \[y=\sin x\],\[x=0\] and \[x=2\pi \]
Let us represent the graph of \[y=\sin x\] from \[x=0\] to \[x=2\pi \].
As we need to find the area from x = 0 to \[x=2\pi \] in the curve of \[y=\sin x\]. We can observe that the area of the curve \[y=\sin x\] from x = 0 to \[x=\pi \] and \[x=\pi \] to \[x=2\pi \] will be equal by the symmetric curve of it.
Hence the area of the shaded region can be calculated as the two lines of the area of \[y=\sin x\] from x = 0 and \[x=\pi \].
Hence we get,
Area of shaded region \[=2\int\limits_{0}^{\pi }{\sin xdx}=2\left( -\cos x \right)_{0}^{\pi }=2\left( -\cos \pi -\left( -cos0 \right) \right)=2\left( 1+1 \right)=4\] sq units
where we used relation \[\int{\sin x dx=-\cos x}\].
Hence, D. \[y=\sin x\],\[x=0\] and \[x=2\pi \] will match to 3. 4 sq units of column II.
So we get the answer as,
\[\begin{align}
& A\to 4 \\
& B\to 1 \\
& C\to 2 \\
& D\to 3 \\
\end{align}\]
Note:
Draw the diagram very clearly so that one can easily observe the bounded area by the given curves. We don’t need to be confused with the graph of \[y={{x}^{4}}\]. It will just be similar to the curve \[y={{x}^{2}}\], as both are symmetric about y-axis because both are even functions. So don’t confuse it with the graph of it.
One may find the areas of all the given bounded regions w.r.t. ‘dy’ as well.
One may go wrong with the last part as he/she may integrate sinx from o to \[2\pi \] and gets area as 0.
\[\int\limits_{0}^{2\pi }{\sin x}=\left( -\cos x \right)_{0}^{2\pi }=-\left( \cos 2\pi -\cos 0 \right)=-0=0\].
It is happening because the area is a positive value and we will get the area of sinx from \[\pi \] to \[2\pi \] as ‘-2’ and area of sinx from 0 to \[\pi \] as 2. So we need to take the positive value of \[\int\limits_{0}^{2\pi }{\sin x}dx\] i.e. the positive of ‘-2’ is 2. So it can be a major mistake by the students.
Recently Updated Pages
Master Class 12 Business Studies: Engaging Questions & Answers for Success
Master Class 12 Chemistry: Engaging Questions & Answers for Success
Master Class 12 Biology: Engaging Questions & Answers for Success
Class 12 Question and Answer - Your Ultimate Solutions Guide
Master Class 11 English: Engaging Questions & Answers for Success
Master Class 11 Maths: Engaging Questions & Answers for Success
Trending doubts
Which is more stable and why class 12 chemistry CBSE
Which are the Top 10 Largest Countries of the World?
Draw a labelled sketch of the human eye class 12 physics CBSE
Differentiate between homogeneous and heterogeneous class 12 chemistry CBSE
What are the major means of transport Explain each class 12 social science CBSE
Sulphuric acid is known as the king of acids State class 12 chemistry CBSE