


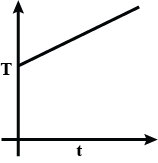
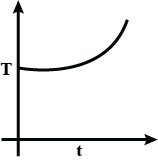
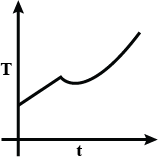
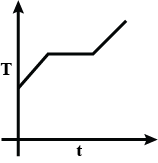
Liquefied oxygen at 1 atmosphere is heated from 50 K to 300 K by supplying heat at a constant I rate. The graph that correctly shows the relationship between temperature and time is:
A.
B.
C.

D.
Answer
610.8k+ views
Hint: When liquefied oxygen is heated from 50K to 300K, first its temperature increases then the conversion of liquid state to gaseous state begins and at this time the liquid state and gaseous state are in equilibrium. After that, for some time the heat applied does not affect the temperature of the liquid oxygen and after that, the temperature starts increasing and the liquid completely changes into the gaseous state.
Complete answer:In this question we have asked what will happen when we heat liquefied oxygen from 50k to 300k then what will be the relation between temperature and time. As we know, the boiling point of the oxygen is 90.19k which means at this temperature liquefied oxygen changes into oxygen gas.
At first, we have liquefied oxygen at 50K, when we start heating it, its temperature will increase up to 90.19K, which is its boiling point. At this temperature gas and liquid is in equilibrium. At this point when we heat the oxygen temperature will not increase because oxygen uses this heat as latent heat of vaporization. After the complete conversion of liquefied oxygen into oxygen gas, the temperature will again increase. So, at first temperature increases, then the constant temperature and then it increases again.
So we get a curve like
So, the correct option will be C.
Note:
The latent heat of vaporization can be defined as the heat required to change one mole of liquid at its boiling point under standard atmospheric pressure.
Recently Updated Pages
Master Class 11 Social Science: Engaging Questions & Answers for Success
Master Class 11 Physics: Engaging Questions & Answers for Success
Master Class 11 Maths: Engaging Questions & Answers for Success
Master Class 11 Economics: Engaging Questions & Answers for Success
Master Class 11 Computer Science: Engaging Questions & Answers for Success
Master Class 11 Chemistry: Engaging Questions & Answers for Success
Trending doubts
One Metric ton is equal to kg A 10000 B 1000 C 100 class 11 physics CBSE
There are 720 permutations of the digits 1 2 3 4 5 class 11 maths CBSE
1 Quintal is equal to a 110 kg b 10 kg c 100kg d 1000 class 11 physics CBSE
State and prove Bernoullis theorem class 11 physics CBSE
Difference Between Prokaryotic Cells and Eukaryotic Cells
Discuss the various forms of bacteria class 11 biology CBSE