


Let S be the area of the region enclosed by $y = {e^{ - {x^2}}},y = 0,x = 0,x = 1.$ Then,
A) $S \geqslant \dfrac{1}{e}$
B) $S \geqslant 1 - \dfrac{1}{e}$
C) $S \leqslant \dfrac{1}{4}(1 + \dfrac{1}{{\sqrt e }})$
D) $S \leqslant \dfrac{1}{{\sqrt 2 }} + \dfrac{1}{{\sqrt e }}(1 - \dfrac{1}{{\sqrt 2 }})$
Answer
583.2k+ views
Hint: First we have to draw the figure and understand the area $S$. Then the first two options can be checked simply using the values of $x,y$. Using B, C can be checked. Certain rearrangements are needed to check D. The concept used here is that the area under a curve is equal to the integral value. For applying this we have to find the limits as well.
Formula used:
Area enclosed by a curve $y = f(x)$ within the limits $x = a$ to $x = b$ is simply the integral of the curve with same limits.
$ \Rightarrow S = \int\limits_a^b {f(x)dx} $
Complete step by step answer:
Given that $S$ is the area enclosed by $y = {e^{ - {x^2}}},y = 0,x = 0,x = 1.$
$y = 0,x = 0$ represent the $x,y$ axis respectively.
Let the curve drawn represent $y = {e^{ - {x^2}}}$.
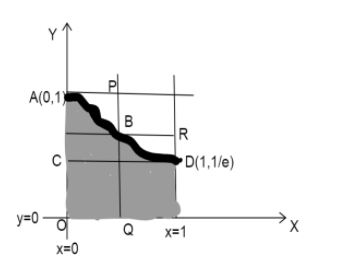
In the figure, the shaded portion represents the area $S$.
When $x = 1 \Rightarrow y = {e^{ - {x^2}}} = {e^{ - 1}} = \dfrac{1}{e}$.
Since $S$ contains a rectangle OSDC with vertices $(0,0),(1,0),(1,\dfrac{1}{e}),(0,\dfrac{1}{e})$, where S(1,0).
The area of that rectangle will be $A = length \times breadth $
$\Rightarrow A= 1 \times \dfrac{1}{e} = \dfrac{1}{e}$.
Therefore clearly $S \geqslant \dfrac{1}{e}$.
This implies option A is right.
Also, since $S$ is the area enclosed by the curve $y = {e^{ - {x^2}}},x = 0,y = 0,x = 1$
We can consider $S = \int\limits_0^1 {{e^{ - {x^2}}}} dx$.
$\Rightarrow x \in [0,1] \Rightarrow {x^2} \leqslant x$
Multiplying both sides by $ - 1$ and taking exponents we have,
$\Rightarrow - {x^2} \geqslant - x \Rightarrow {e^{ - {x^2}}} \geqslant {e^{ - x}}$
Therefore, $S = \int\limits_0^1 {{e^{ - {x^2}}}} dx \geqslant \int\limits_0^1 {{e^{ - x}}} dx$
Integrating we get, $S \geqslant [ - {e^{ - x}}]_0^1 = {e^0} - {e^{ - 1}} = 1 - \dfrac{1}{e}$
$ \Rightarrow S \geqslant 1 - \dfrac{1}{e}$
Therefore option B is also right.
To show that option C is incorrect,
$\Rightarrow e > \sqrt e \Rightarrow \dfrac{1}{e} < \dfrac{1}{{\sqrt e }}$
$ \Rightarrow - \dfrac{1}{e} < \dfrac{1}{{\sqrt e }} \Rightarrow 1 - \dfrac{1}{e} < 1 + \dfrac{1}{{\sqrt e }} < \dfrac{1}{4}(1 + \dfrac{1}{{\sqrt e }})$
This implies $1 - \dfrac{1}{e} < \dfrac{1}{4}(1 + \dfrac{1}{{\sqrt e }})$
From B, we have $S \geqslant 1 - \dfrac{1}{e}$
Using these two equations we can say C is incorrect.
Moving on, consider two rectangles in the figure OAPQ and QBRS where $S(1,0)$,
Clearly $S \leqslant $ Area of OAPQ$ + $ Area of QBRS
PQ is drawn parallel to Y axis at the point $x = \dfrac{1}{{\sqrt 2 }}$.
Then $y = {e^{ - {x^2}}} = {e^{ - \dfrac{1}{2}}} = \dfrac{1}{{\sqrt e }}$.
Therefore, B is the point $(\dfrac{1}{{\sqrt 2 }},\dfrac{1}{{\sqrt e }})$.
Area of OAPQ $ = lenth \times breadth = 1 \times \dfrac{1}{{\sqrt 2 }} = \dfrac{1}{{\sqrt 2 }}$
In QBRS, $QB = \dfrac{1}{{\sqrt e }},BR = 1 - \dfrac{1}{{\sqrt 2 }}$
Therefore, Area of QBRS $ = length \times breadth = \dfrac{1}{{\sqrt e }} \times 1 - \dfrac{1}{{\sqrt 2 }}$
$ \Rightarrow S \leqslant AreaOAPQ + AreaQBRS = \dfrac{1}{{\sqrt 2 }} + \dfrac{1}{{\sqrt e }}(1 - \dfrac{1}{{\sqrt 2 }})$
So, option D is correct.
Therefore, Option (A), (B) and (D) are correct.
Note:
It is important to identify the graph of the given function and mark the given region. If there is some portion under the X-axis, this area will be negative. So be careful in those cases to split the region if necessary and find the area separately.
Formula used:
Area enclosed by a curve $y = f(x)$ within the limits $x = a$ to $x = b$ is simply the integral of the curve with same limits.
$ \Rightarrow S = \int\limits_a^b {f(x)dx} $
Complete step by step answer:
Given that $S$ is the area enclosed by $y = {e^{ - {x^2}}},y = 0,x = 0,x = 1.$
$y = 0,x = 0$ represent the $x,y$ axis respectively.
Let the curve drawn represent $y = {e^{ - {x^2}}}$.
In the figure, the shaded portion represents the area $S$.
When $x = 1 \Rightarrow y = {e^{ - {x^2}}} = {e^{ - 1}} = \dfrac{1}{e}$.
Since $S$ contains a rectangle OSDC with vertices $(0,0),(1,0),(1,\dfrac{1}{e}),(0,\dfrac{1}{e})$, where S(1,0).
The area of that rectangle will be $A = length \times breadth $
$\Rightarrow A= 1 \times \dfrac{1}{e} = \dfrac{1}{e}$.
Therefore clearly $S \geqslant \dfrac{1}{e}$.
This implies option A is right.
Also, since $S$ is the area enclosed by the curve $y = {e^{ - {x^2}}},x = 0,y = 0,x = 1$
We can consider $S = \int\limits_0^1 {{e^{ - {x^2}}}} dx$.
$\Rightarrow x \in [0,1] \Rightarrow {x^2} \leqslant x$
Multiplying both sides by $ - 1$ and taking exponents we have,
$\Rightarrow - {x^2} \geqslant - x \Rightarrow {e^{ - {x^2}}} \geqslant {e^{ - x}}$
Therefore, $S = \int\limits_0^1 {{e^{ - {x^2}}}} dx \geqslant \int\limits_0^1 {{e^{ - x}}} dx$
Integrating we get, $S \geqslant [ - {e^{ - x}}]_0^1 = {e^0} - {e^{ - 1}} = 1 - \dfrac{1}{e}$
$ \Rightarrow S \geqslant 1 - \dfrac{1}{e}$
Therefore option B is also right.
To show that option C is incorrect,
$\Rightarrow e > \sqrt e \Rightarrow \dfrac{1}{e} < \dfrac{1}{{\sqrt e }}$
$ \Rightarrow - \dfrac{1}{e} < \dfrac{1}{{\sqrt e }} \Rightarrow 1 - \dfrac{1}{e} < 1 + \dfrac{1}{{\sqrt e }} < \dfrac{1}{4}(1 + \dfrac{1}{{\sqrt e }})$
This implies $1 - \dfrac{1}{e} < \dfrac{1}{4}(1 + \dfrac{1}{{\sqrt e }})$
From B, we have $S \geqslant 1 - \dfrac{1}{e}$
Using these two equations we can say C is incorrect.
Moving on, consider two rectangles in the figure OAPQ and QBRS where $S(1,0)$,
Clearly $S \leqslant $ Area of OAPQ$ + $ Area of QBRS
PQ is drawn parallel to Y axis at the point $x = \dfrac{1}{{\sqrt 2 }}$.
Then $y = {e^{ - {x^2}}} = {e^{ - \dfrac{1}{2}}} = \dfrac{1}{{\sqrt e }}$.
Therefore, B is the point $(\dfrac{1}{{\sqrt 2 }},\dfrac{1}{{\sqrt e }})$.
Area of OAPQ $ = lenth \times breadth = 1 \times \dfrac{1}{{\sqrt 2 }} = \dfrac{1}{{\sqrt 2 }}$
In QBRS, $QB = \dfrac{1}{{\sqrt e }},BR = 1 - \dfrac{1}{{\sqrt 2 }}$
Therefore, Area of QBRS $ = length \times breadth = \dfrac{1}{{\sqrt e }} \times 1 - \dfrac{1}{{\sqrt 2 }}$
$ \Rightarrow S \leqslant AreaOAPQ + AreaQBRS = \dfrac{1}{{\sqrt 2 }} + \dfrac{1}{{\sqrt e }}(1 - \dfrac{1}{{\sqrt 2 }})$
So, option D is correct.
Therefore, Option (A), (B) and (D) are correct.
Note:
It is important to identify the graph of the given function and mark the given region. If there is some portion under the X-axis, this area will be negative. So be careful in those cases to split the region if necessary and find the area separately.
Recently Updated Pages
Master Class 12 Economics: Engaging Questions & Answers for Success
Master Class 12 Physics: Engaging Questions & Answers for Success
Master Class 12 English: Engaging Questions & Answers for Success
Master Class 12 Social Science: Engaging Questions & Answers for Success
Master Class 12 Maths: Engaging Questions & Answers for Success
Master Class 12 Business Studies: Engaging Questions & Answers for Success
Trending doubts
Which are the Top 10 Largest Countries of the World?
What are the major means of transport Explain each class 12 social science CBSE
Draw a labelled sketch of the human eye class 12 physics CBSE
What is a transformer Explain the principle construction class 12 physics CBSE
Why cannot DNA pass through cell membranes class 12 biology CBSE
Differentiate between insitu conservation and exsitu class 12 biology CBSE