


Let $f:R \to R$ be defined as $f(x) = \left| x \right| + \left| {{x^2} - 1} \right|$. The total number of points at which $f$ attains either a local maximum or a local minimum is
A. 5
B. 6
C. 7
D. 8
Answer
586.8k+ views
Hint: First of all this is a very simple and a very easy problem. Here this problem deals with arranging the intervals accordingly as the modulus is involved in the function. In order to solve this problem we should know how to split the intervals of x and when to split the intervals of x as f is defined on the real number set. Once the splitting of the intervals is done according to the modulus, almost the job is done, the rest is plotting the obtained function on a graph.
Complete step-by-step solution:
Given that the function $f$ exists from all real numbers to all real numbers.
Here $f$ is defined as $f:R \to R$.
$ \Rightarrow f(x) = \left| x \right| + \left| {{x^2} - 1} \right|$
Here due to the presence of modulus to $x$ and $\left( {{x^2} - 1} \right)$ subdividing the function $f(x)$into several intervals of $x$ as required.
Hence the function $f(x)$ is subdivided into the functions according to the value of $x$.
\[ \Rightarrow f(x) = \left| x \right| + \left| {{x^2} - 1} \right| = \left\{ {\begin{array}{*{20}{c}}
{\begin{array}{*{20}{c}}
{x + ({x^2} - 1)} \\
{x - ({x^2} - 1)} \\
{ - x - ({x^2} - 1)} \\
{ - x + ({x^2} - 1)}
\end{array}}&{\begin{array}{*{20}{c}}
; \\
; \\
; \\
;
\end{array}}&{\begin{array}{*{20}{c}}
{x > 1} \\
{0 < x < 1} \\
{ - 1 < x < 0} \\
{x < - 1}
\end{array}}
\end{array}} \right.\]
\[ \Rightarrow f(x) = \left| x \right| + \left| {{x^2} - 1} \right| = \left\{ {\begin{array}{*{20}{c}}
{\begin{array}{*{20}{c}}
{{x^2} + x - 1} \\
{ - {x^2} + x + 1} \\
{ - {x^2} - x + 1} \\
{{x^2} - x - 1}
\end{array}}&{\begin{array}{*{20}{c}}
; \\
; \\
; \\
;
\end{array}}&{\begin{array}{*{20}{c}}
{x > 1} \\
{0 < x < 1} \\
{ - 1 < x < 0} \\
{x < - 1}
\end{array}}
\end{array}} \right.\]
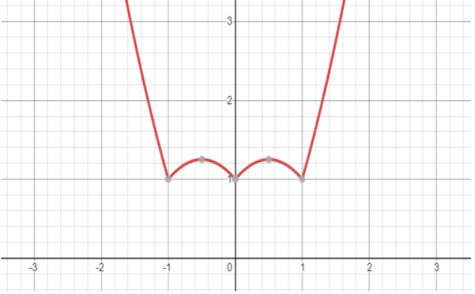
Hence plotting the function $f(x)$ on the vertical and the horizontal axis, as given below:
Here we are going to understand how the sub-intervals are subdivided according to $x$and the modulus involved in the function.
First the considered interval of $x$ is \[x > 1\], here if $x$ is greater than 1, then both $\left| x \right|$ and $\left| {{x^2} - 1} \right|$ are positive, hence the $f(x)$ would be, as given below:
$ \Rightarrow f(x) = x + ({x^2} - 1)$
$ \Rightarrow f(x) = {x^2} + x - 1$
The second considered interval of $x$ is \[0 < x < 1\], here if $x$ is greater than 0 and less than 1, then the function $\left| x \right|$ is positive and $\left| {{x^2} - 1} \right|$ would be negative, hence the $f(x)$ would be, as given below:
$ \Rightarrow f(x) = x - ({x^2} - 1)$
$ \Rightarrow f(x) = - {x^2} + x + 1$
The third considered interval of $x$ is \[ - 1 < x < 0\], here if $x$ is less than 0 and greater than -1, then both $\left| x \right|$ and $\left| {{x^2} - 1} \right|$ would be negative, hence the $f(x)$ would be, as given below:
$ \Rightarrow f(x) = - x - ({x^2} - 1)$
$ \Rightarrow f(x) = - {x^2} - x + 1$
The fourth considered interval of $x$ is \[x < - 1\], here if $x$ is less than -1, then both the function $\left| x \right|$would be negative and $\left| {{x^2} - 1} \right|$ would be positive, hence the $f(x)$ would be, as given below:
$ \Rightarrow f(x) = - x + ({x^2} - 1)$
$ \Rightarrow f(x) = {x^2} - x - 1$
Now looking at the graph the graph has multiple ups and downs.
The graph has 3 dips at one and 2 maximums at greater than one and less than two.
Hence the graph has in total 5 points at maximums and minimums together.
The total number of points at which $f$ attains either a local maximum or a local minimum is 5.
Note: While solving this problem the most important and crucial thing to remember is that while considering the intervals of x in f(x), we have to observe carefully and compute inside the modulus first for each interval of x, and then proceed to plot the graph. One more important thing is that finding the no. of points of maximums and minimums in the plotted graph, can also be done by observing the no. of change in the turnings of the curve of the graph as well tells the total no. of maximums and minimums.
Complete step-by-step solution:
Given that the function $f$ exists from all real numbers to all real numbers.
Here $f$ is defined as $f:R \to R$.
$ \Rightarrow f(x) = \left| x \right| + \left| {{x^2} - 1} \right|$
Here due to the presence of modulus to $x$ and $\left( {{x^2} - 1} \right)$ subdividing the function $f(x)$into several intervals of $x$ as required.
Hence the function $f(x)$ is subdivided into the functions according to the value of $x$.
\[ \Rightarrow f(x) = \left| x \right| + \left| {{x^2} - 1} \right| = \left\{ {\begin{array}{*{20}{c}}
{\begin{array}{*{20}{c}}
{x + ({x^2} - 1)} \\
{x - ({x^2} - 1)} \\
{ - x - ({x^2} - 1)} \\
{ - x + ({x^2} - 1)}
\end{array}}&{\begin{array}{*{20}{c}}
; \\
; \\
; \\
;
\end{array}}&{\begin{array}{*{20}{c}}
{x > 1} \\
{0 < x < 1} \\
{ - 1 < x < 0} \\
{x < - 1}
\end{array}}
\end{array}} \right.\]
\[ \Rightarrow f(x) = \left| x \right| + \left| {{x^2} - 1} \right| = \left\{ {\begin{array}{*{20}{c}}
{\begin{array}{*{20}{c}}
{{x^2} + x - 1} \\
{ - {x^2} + x + 1} \\
{ - {x^2} - x + 1} \\
{{x^2} - x - 1}
\end{array}}&{\begin{array}{*{20}{c}}
; \\
; \\
; \\
;
\end{array}}&{\begin{array}{*{20}{c}}
{x > 1} \\
{0 < x < 1} \\
{ - 1 < x < 0} \\
{x < - 1}
\end{array}}
\end{array}} \right.\]
Hence plotting the function $f(x)$ on the vertical and the horizontal axis, as given below:
Here we are going to understand how the sub-intervals are subdivided according to $x$and the modulus involved in the function.
First the considered interval of $x$ is \[x > 1\], here if $x$ is greater than 1, then both $\left| x \right|$ and $\left| {{x^2} - 1} \right|$ are positive, hence the $f(x)$ would be, as given below:
$ \Rightarrow f(x) = x + ({x^2} - 1)$
$ \Rightarrow f(x) = {x^2} + x - 1$
The second considered interval of $x$ is \[0 < x < 1\], here if $x$ is greater than 0 and less than 1, then the function $\left| x \right|$ is positive and $\left| {{x^2} - 1} \right|$ would be negative, hence the $f(x)$ would be, as given below:
$ \Rightarrow f(x) = x - ({x^2} - 1)$
$ \Rightarrow f(x) = - {x^2} + x + 1$
The third considered interval of $x$ is \[ - 1 < x < 0\], here if $x$ is less than 0 and greater than -1, then both $\left| x \right|$ and $\left| {{x^2} - 1} \right|$ would be negative, hence the $f(x)$ would be, as given below:
$ \Rightarrow f(x) = - x - ({x^2} - 1)$
$ \Rightarrow f(x) = - {x^2} - x + 1$
The fourth considered interval of $x$ is \[x < - 1\], here if $x$ is less than -1, then both the function $\left| x \right|$would be negative and $\left| {{x^2} - 1} \right|$ would be positive, hence the $f(x)$ would be, as given below:
$ \Rightarrow f(x) = - x + ({x^2} - 1)$
$ \Rightarrow f(x) = {x^2} - x - 1$
Now looking at the graph the graph has multiple ups and downs.
The graph has 3 dips at one and 2 maximums at greater than one and less than two.
Hence the graph has in total 5 points at maximums and minimums together.
The total number of points at which $f$ attains either a local maximum or a local minimum is 5.
Note: While solving this problem the most important and crucial thing to remember is that while considering the intervals of x in f(x), we have to observe carefully and compute inside the modulus first for each interval of x, and then proceed to plot the graph. One more important thing is that finding the no. of points of maximums and minimums in the plotted graph, can also be done by observing the no. of change in the turnings of the curve of the graph as well tells the total no. of maximums and minimums.
Recently Updated Pages
Three beakers labelled as A B and C each containing 25 mL of water were taken A small amount of NaOH anhydrous CuSO4 and NaCl were added to the beakers A B and C respectively It was observed that there was an increase in the temperature of the solutions contained in beakers A and B whereas in case of beaker C the temperature of the solution falls Which one of the following statements isarecorrect i In beakers A and B exothermic process has occurred ii In beakers A and B endothermic process has occurred iii In beaker C exothermic process has occurred iv In beaker C endothermic process has occurred
Master Class 12 Social Science: Engaging Questions & Answers for Success
Master Class 12 Physics: Engaging Questions & Answers for Success
Master Class 12 Maths: Engaging Questions & Answers for Success
Master Class 12 Economics: Engaging Questions & Answers for Success
Master Class 12 Chemistry: Engaging Questions & Answers for Success
Three beakers labelled as A B and C each containing 25 mL of water were taken A small amount of NaOH anhydrous CuSO4 and NaCl were added to the beakers A B and C respectively It was observed that there was an increase in the temperature of the solutions contained in beakers A and B whereas in case of beaker C the temperature of the solution falls Which one of the following statements isarecorrect i In beakers A and B exothermic process has occurred ii In beakers A and B endothermic process has occurred iii In beaker C exothermic process has occurred iv In beaker C endothermic process has occurred
Master Class 12 Social Science: Engaging Questions & Answers for Success
Master Class 12 Physics: Engaging Questions & Answers for Success
Trending doubts
Which are the Top 10 Largest Countries of the World?
Draw a labelled sketch of the human eye class 12 physics CBSE
What are the major means of transport Explain each class 12 social science CBSE
Differentiate between homogeneous and heterogeneous class 12 chemistry CBSE
Sulphuric acid is known as the king of acids State class 12 chemistry CBSE
Why should a magnesium ribbon be cleaned before burning class 12 chemistry CBSE