


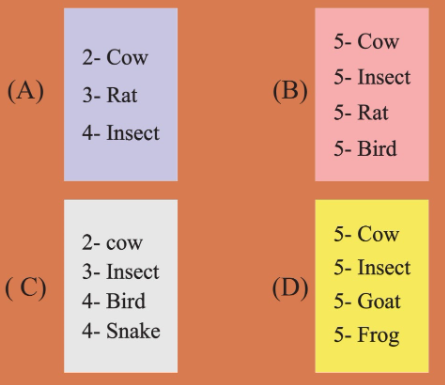
In the above diagram, four areas are given. In which area has maximum species diversity
(A)A
(B)C
(C)B
(D)D
Answer
568.5k+ views
Hint: Diversity is a general count of the types of organisms present in a locality.
Species diversity can be defined as the total variety of species present in an area. It is also determined in terms of species richness, taxonomic diversity, and species evenness.
Complete answer:
- In diagram A, we have 1 mammal (cow and rat) and 1 insect. So, total diversity will be 2.
- In diagram B, we have 1 mammal (cow and rat), 1 insect, and 1 bird. So, total diversity will be 3.
- In diagram C, we have 1 mammal (cow), 1 insect, 1 bird, and 1 reptile (snake). So, total diversity will be 4.
- In diagram D, we have 1 mammal (cow and goat),1 insect, and 1 Amphibian (frog). So, total diversity will be 3.
Additional Information: Taxonomic or Phylogenetic diversity can be understood as the relationship shared among different species of organisms. Species evenness determines the equal distribution of species. Species richness is the actual numerical parameter quantifying the species diversity. There are several other diversity indices such as the Shannon index, Simpson index, and Gini-Simpson index. Species diversity is important to maintain sustainability and balance in the ecosystem. Niche- An ecological niche refers to the relationship between the species and the biotic and abiotic components of its habitat. Species diversity along with genetic diversity and ecosystem diversity forms the base of biodiversity.
So, the correct answer is the area ‘ C’.
Note: Species diversity drawn from the organisms of different habitats is greater than that calculated from the species of similar habitats. Greater is the area under observation, greater is the species diversity.
Recently Updated Pages
Master Class 12 Economics: Engaging Questions & Answers for Success
Master Class 12 Physics: Engaging Questions & Answers for Success
Master Class 12 English: Engaging Questions & Answers for Success
Master Class 12 Social Science: Engaging Questions & Answers for Success
Master Class 12 Maths: Engaging Questions & Answers for Success
Master Class 12 Business Studies: Engaging Questions & Answers for Success
Trending doubts
Which are the Top 10 Largest Countries of the World?
What are the major means of transport Explain each class 12 social science CBSE
Draw a labelled sketch of the human eye class 12 physics CBSE
Why cannot DNA pass through cell membranes class 12 biology CBSE
Differentiate between insitu conservation and exsitu class 12 biology CBSE
Draw a neat and well labeled diagram of TS of ovary class 12 biology CBSE