


If a Venn diagram used to represent probabilities, sample space of events is represented by
A .Square
B. Triangle
C. Circle
D. Rectangle
Answer
581.1k+ views
Hint:
In this type of question, first consider an example related to the Venn diagram, then solve or draw the considered example and at last conclude from your example, what type of figure comes by using Venn diagram.
Complete step by step solution:
To solve this question, let us consider an example “Let's say our sample space is the numbers from 1 to 10. Event A is randomly choosing one to one of the odd numbers from 1 to 10, and event B is randomly choosing one of the prime numbers from 1 to 10. Draw a Venn diagram to represent this example.”
For the example , we know that
Sample space =$S=\left\{ 1, 2, 3, 4, 5, 6, 7, 8, 9, 10 \right\}$
Event $A=\left\{ 1, 3, 5, 7, 9 \right\}$
Event $B=\left\{ 2, 3, 5, 7 \right\}$
Let us draw a Venn diagram, we get
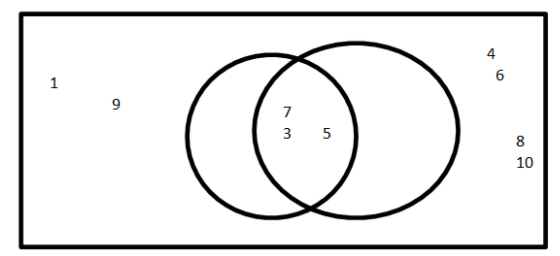
It is clear from the above diagram, the sample space and an event can be represented on a Venn diagram, where sample space is represented by the shape rectangle and the event is represented by the shape of the circle.
Therefore if a Venn diagram is used to represent probabilities, sample space of events represented by rectangle.
Hence option D is the correct option.
Note:
In such types of problems, students get confused while using anything related to intersection, when event A and event B occurs, the symbol used is $\bigcap $. Therefore $A\bigcap B$ is the intersection of event A and B and can be used to find the probability of both events occurring.
In this type of question, first consider an example related to the Venn diagram, then solve or draw the considered example and at last conclude from your example, what type of figure comes by using Venn diagram.
Complete step by step solution:
To solve this question, let us consider an example “Let's say our sample space is the numbers from 1 to 10. Event A is randomly choosing one to one of the odd numbers from 1 to 10, and event B is randomly choosing one of the prime numbers from 1 to 10. Draw a Venn diagram to represent this example.”
For the example , we know that
Sample space =$S=\left\{ 1, 2, 3, 4, 5, 6, 7, 8, 9, 10 \right\}$
Event $A=\left\{ 1, 3, 5, 7, 9 \right\}$
Event $B=\left\{ 2, 3, 5, 7 \right\}$
Let us draw a Venn diagram, we get
It is clear from the above diagram, the sample space and an event can be represented on a Venn diagram, where sample space is represented by the shape rectangle and the event is represented by the shape of the circle.
Therefore if a Venn diagram is used to represent probabilities, sample space of events represented by rectangle.
Hence option D is the correct option.
Note:
In such types of problems, students get confused while using anything related to intersection, when event A and event B occurs, the symbol used is $\bigcap $. Therefore $A\bigcap B$ is the intersection of event A and B and can be used to find the probability of both events occurring.
Recently Updated Pages
Master Class 12 Economics: Engaging Questions & Answers for Success
Master Class 12 Physics: Engaging Questions & Answers for Success
Master Class 12 English: Engaging Questions & Answers for Success
Master Class 12 Social Science: Engaging Questions & Answers for Success
Master Class 12 Maths: Engaging Questions & Answers for Success
Master Class 12 Business Studies: Engaging Questions & Answers for Success
Trending doubts
Which are the Top 10 Largest Countries of the World?
What are the major means of transport Explain each class 12 social science CBSE
Draw a labelled sketch of the human eye class 12 physics CBSE
Why cannot DNA pass through cell membranes class 12 biology CBSE
Differentiate between insitu conservation and exsitu class 12 biology CBSE
Draw a neat and well labeled diagram of TS of ovary class 12 biology CBSE