


How do you solve and graph $4x - 3 < 9$?
Answer
577.5k+ views
Hint: In this equation we have one variable, that is $x$, therefore there is only going to be only a vertical line, which means we will have a vertical graph for the equation $4x - 3 < 9$. We will therefore have a dotted line as a graph because the function is $4x - 3$, which is LESS THAN $9$ not less than or equal to 9.
Complete step-by-step solution:
First of all, we will take our equation $4x - 3 < 9$, and then shift the constants to the side of the inequality, since we have a constant there already, and this will help us know the value of $x$ apparently.
So, shifting $ - 3$ to the side of inequality,
$ \Rightarrow 4x < 9 + 3$
Now, we have $9$ and $3$ 0n one side, with an addition sign between them,
Adding the two constants,
$ \Rightarrow 4x < 12$
Now, moving the constant that is multiplied with $x$ to the other side and dividing it,
$ \Rightarrow x < \dfrac{{12}}{4}$
We know that $12$ is divisible by $4$,
So, dividing the numbers,
$ \Rightarrow x < 3$
We got the value of $x$ as less than $3$, so the values that are less than that will help in plotting the graph for $4x - 3 < 9$, and since it is LESS THAN, there will be a dotted line as an equation.
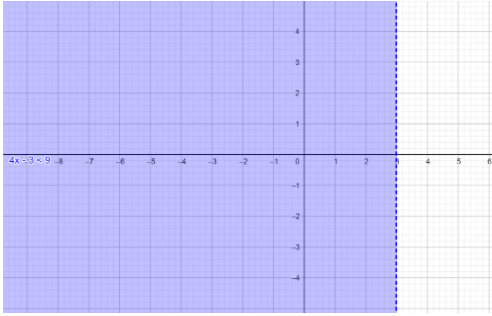
Since the value is $x < 3$, that means the value of $x$ should be $2,1\,\,or\,\,0...$,and so on, since these are satisfying the condition respectively.
Note: This is an inequality linear graph, which involves the symbols of inequality signs like $ < , > $. It shows the data which is not equal in graph form. A linear inequality looks exactly like a linear equation, with the inequality sign replacing the equality sign.
Complete step-by-step solution:
First of all, we will take our equation $4x - 3 < 9$, and then shift the constants to the side of the inequality, since we have a constant there already, and this will help us know the value of $x$ apparently.
So, shifting $ - 3$ to the side of inequality,
$ \Rightarrow 4x < 9 + 3$
Now, we have $9$ and $3$ 0n one side, with an addition sign between them,
Adding the two constants,
$ \Rightarrow 4x < 12$
Now, moving the constant that is multiplied with $x$ to the other side and dividing it,
$ \Rightarrow x < \dfrac{{12}}{4}$
We know that $12$ is divisible by $4$,
So, dividing the numbers,
$ \Rightarrow x < 3$
We got the value of $x$ as less than $3$, so the values that are less than that will help in plotting the graph for $4x - 3 < 9$, and since it is LESS THAN, there will be a dotted line as an equation.
Since the value is $x < 3$, that means the value of $x$ should be $2,1\,\,or\,\,0...$,and so on, since these are satisfying the condition respectively.
Note: This is an inequality linear graph, which involves the symbols of inequality signs like $ < , > $. It shows the data which is not equal in graph form. A linear inequality looks exactly like a linear equation, with the inequality sign replacing the equality sign.

Recently Updated Pages
Master Class 9 Social Science: Engaging Questions & Answers for Success
Master Class 9 Science: Engaging Questions & Answers for Success
Master Class 9 Maths: Engaging Questions & Answers for Success
Master Class 9 General Knowledge: Engaging Questions & Answers for Success
Class 9 Question and Answer - Your Ultimate Solutions Guide
Master Class 8 Social Science: Engaging Questions & Answers for Success
Trending doubts
Find the sum of series 1 + 2 + 3 + 4 + 5 + + 100 class 9 maths CBSE
What is the Full Form of ISI and RAW
Fill the blanks with the suitable prepositions 1 The class 9 english CBSE
Difference Between Plant Cell and Animal Cell
Who is eligible for RTE class 9 social science CBSE
What is pollution? How many types of pollution? Define it