


How do you graph $y=\sin x$ and $y=\cos x$ .
Answer
583.5k+ views
Hint: To draw the graph of $y=\sin x$ , we have to consider different values of x and find the corresponding values of y. We have consider $x=0,\pm \dfrac{\pi }{2},\pm \pi ,\pm \dfrac{3\pi }{2},\pm 2\pi $ and find the corresponding values of y. To draw the graph of $y=\cos x$ , we will do the similar procedure.
Complete step by step solution:
We have to graph $y=\sin x$ and $y=\cos x$ . Let us first consider $y=\sin x$ . We have to consider different values of x and find the corresponding values of y.
Let us consider $x=0$ . We have to substitute the value of x in $y=\sin x$ .
$\Rightarrow y=\sin 0=0$
Let us consider $x=\dfrac{\pi }{2}$ .
\[\Rightarrow y=\sin \dfrac{\pi }{2}=1\]
We have to consider $x=\pi $ .
\[\Rightarrow y=\sin \pi =0\]
Let us consider $x=\dfrac{3\pi }{2}$ .
\[\Rightarrow y=\sin \dfrac{3\pi }{2}=-1\]
We have to consider $x=2\pi $ .
\[\Rightarrow y=\sin 2\pi =0\]
Now, let us consider the negative values. So when $x=-\dfrac{\pi }{2}$
\[\Rightarrow y=\sin \left( -\dfrac{\pi }{2} \right)\]
We know that $\sin \left( -\theta \right)=-\sin \theta $ .
\[\Rightarrow y=-\sin \left( \dfrac{\pi }{2} \right)=-1\]
We have to consider $x=-\pi $ .
\[\Rightarrow y=\sin \left( -\pi \right)=0\]
Let us consider $x=-\dfrac{3\pi }{2}$ .
\[\Rightarrow y=\sin \left( -\dfrac{3\pi }{2} \right)=-\sin \left( \dfrac{3\pi }{2} \right)=1\]
We have to consider $x=-2\pi $ .
\[\Rightarrow y=\sin \left( -2\pi \right)=0\]
Let us tabulate these values.
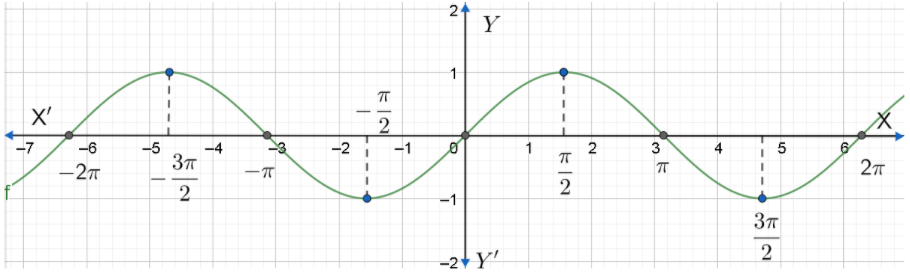
Now, let us plot the graph. Firstly, we have to plot the points in the graph. We have to convert $\pi $ into its numerical form, that is, 3.14 and plot the corresponding points. Then, we have to join the points as a curve. The graph of $y=\sin x$ is shown below.
Now, let us consider $y=\cos x$ . Similar to the previous function, we will have to find the points to plot.
Let us consider $x=0$ . We have to substitute the value of x in $y=\cos x$ .
$\Rightarrow y=\cos 0=1$
Let us consider $x=\dfrac{\pi }{2}$ .
\[\Rightarrow y=\cos \dfrac{\pi }{2}=0\]
We have to consider $x=\pi $ .
\[\Rightarrow y=\cos \pi =-1\]
Let us consider $x=\dfrac{3\pi }{2}$ .
\[\Rightarrow y=\cos \dfrac{3\pi }{2}=0\]
We have to consider $x=2\pi $ .
\[\Rightarrow y=\cos 2\pi =1\]
Now, let us consider the negative values. So when $x=-\dfrac{\pi }{2}$
\[\Rightarrow y=\cos \left( -\dfrac{\pi }{2} \right)\]
We know that $\cos \left( -\theta \right)=\cos \theta $ .
\[\Rightarrow y=\cos \left( \dfrac{\pi }{2} \right)=0\]
We have to consider $x=-\pi $ .
\[\Rightarrow y=\cos \left( -\pi \right)=\cos \pi =-1\]
Let us consider $x=-\dfrac{3\pi }{2}$ .
\[\Rightarrow y=\cos \left( -\dfrac{3\pi }{2} \right)=\cos \left( \dfrac{3\pi }{2} \right)=0\]
We have to consider $x=-2\pi $ .
\[\Rightarrow y=\cos \left( -2\pi \right)=\cos \left( 2\pi \right)=1\]
Let us tabulate these values.
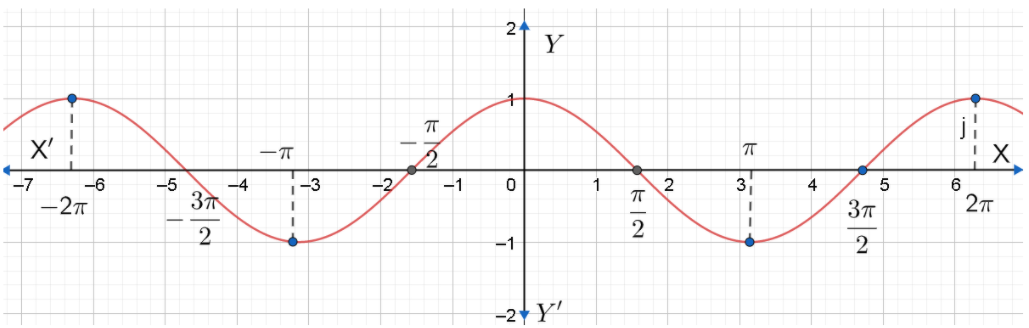
Now, let us plot the graph.
Note: We can also consider other angles also. Students have a chance of making mistakes by considering $\sin \left( -\theta \right)=\sin \theta $ and $\cos \left( -\theta \right)=-\cos \theta $ . We have considered the values of x to be $x=0,\pm \dfrac{\pi }{2},\pm \pi ,\pm \dfrac{3\pi }{2},\pm 2\pi $ as these values are easy to be plotted. We can find the domain and range of $y=\sin x$ and $y=\cos x$ . We know that the domain of a function is the complete set of possible values of the independent variable. Hence, the domain of sin x and cos x is $\left( -\infty ,\infty \right)$ . We know that range of a
Complete step by step solution:
We have to graph $y=\sin x$ and $y=\cos x$ . Let us first consider $y=\sin x$ . We have to consider different values of x and find the corresponding values of y.
Let us consider $x=0$ . We have to substitute the value of x in $y=\sin x$ .
$\Rightarrow y=\sin 0=0$
Let us consider $x=\dfrac{\pi }{2}$ .
\[\Rightarrow y=\sin \dfrac{\pi }{2}=1\]
We have to consider $x=\pi $ .
\[\Rightarrow y=\sin \pi =0\]
Let us consider $x=\dfrac{3\pi }{2}$ .
\[\Rightarrow y=\sin \dfrac{3\pi }{2}=-1\]
We have to consider $x=2\pi $ .
\[\Rightarrow y=\sin 2\pi =0\]
Now, let us consider the negative values. So when $x=-\dfrac{\pi }{2}$
\[\Rightarrow y=\sin \left( -\dfrac{\pi }{2} \right)\]
We know that $\sin \left( -\theta \right)=-\sin \theta $ .
\[\Rightarrow y=-\sin \left( \dfrac{\pi }{2} \right)=-1\]
We have to consider $x=-\pi $ .
\[\Rightarrow y=\sin \left( -\pi \right)=0\]
Let us consider $x=-\dfrac{3\pi }{2}$ .
\[\Rightarrow y=\sin \left( -\dfrac{3\pi }{2} \right)=-\sin \left( \dfrac{3\pi }{2} \right)=1\]
We have to consider $x=-2\pi $ .
\[\Rightarrow y=\sin \left( -2\pi \right)=0\]
Let us tabulate these values.
| x | $y=\sin x$ |
| 0 | 0 |
| $\dfrac{\pi }{2}$ | 1 |
| $\pi $ | 0 |
| $\dfrac{3\pi }{2}$ | -1 |
| $2\pi $ | 0 |
| $-\dfrac{\pi }{2}$ | -1 |
| $-\pi $ | 0 |
| $-\dfrac{3\pi }{2}$ | 1 |
| $-2\pi $ | 0 |
Now, let us plot the graph. Firstly, we have to plot the points in the graph. We have to convert $\pi $ into its numerical form, that is, 3.14 and plot the corresponding points. Then, we have to join the points as a curve. The graph of $y=\sin x$ is shown below.
Now, let us consider $y=\cos x$ . Similar to the previous function, we will have to find the points to plot.
Let us consider $x=0$ . We have to substitute the value of x in $y=\cos x$ .
$\Rightarrow y=\cos 0=1$
Let us consider $x=\dfrac{\pi }{2}$ .
\[\Rightarrow y=\cos \dfrac{\pi }{2}=0\]
We have to consider $x=\pi $ .
\[\Rightarrow y=\cos \pi =-1\]
Let us consider $x=\dfrac{3\pi }{2}$ .
\[\Rightarrow y=\cos \dfrac{3\pi }{2}=0\]
We have to consider $x=2\pi $ .
\[\Rightarrow y=\cos 2\pi =1\]
Now, let us consider the negative values. So when $x=-\dfrac{\pi }{2}$
\[\Rightarrow y=\cos \left( -\dfrac{\pi }{2} \right)\]
We know that $\cos \left( -\theta \right)=\cos \theta $ .
\[\Rightarrow y=\cos \left( \dfrac{\pi }{2} \right)=0\]
We have to consider $x=-\pi $ .
\[\Rightarrow y=\cos \left( -\pi \right)=\cos \pi =-1\]
Let us consider $x=-\dfrac{3\pi }{2}$ .
\[\Rightarrow y=\cos \left( -\dfrac{3\pi }{2} \right)=\cos \left( \dfrac{3\pi }{2} \right)=0\]
We have to consider $x=-2\pi $ .
\[\Rightarrow y=\cos \left( -2\pi \right)=\cos \left( 2\pi \right)=1\]
Let us tabulate these values.
| x | $y=\sin x$ |
| 0 | -1 |
| $\dfrac{\pi }{2}$ | 0 |
| $\pi $ | -1 |
| $\dfrac{3\pi }{2}$ | 0 |
| $2\pi $ | 1 |
| $-\dfrac{\pi }{2}$ | 0 |
| $-\pi $ | -1 |
| $-\dfrac{3\pi }{2}$ | 0 |
| $-2\pi $ | 1 |
Now, let us plot the graph.
Note: We can also consider other angles also. Students have a chance of making mistakes by considering $\sin \left( -\theta \right)=\sin \theta $ and $\cos \left( -\theta \right)=-\cos \theta $ . We have considered the values of x to be $x=0,\pm \dfrac{\pi }{2},\pm \pi ,\pm \dfrac{3\pi }{2},\pm 2\pi $ as these values are easy to be plotted. We can find the domain and range of $y=\sin x$ and $y=\cos x$ . We know that the domain of a function is the complete set of possible values of the independent variable. Hence, the domain of sin x and cos x is $\left( -\infty ,\infty \right)$ . We know that range of a
Recently Updated Pages
Master Class 11 English: Engaging Questions & Answers for Success
Master Class 11 Physics: Engaging Questions & Answers for Success
Master Class 11 Computer Science: Engaging Questions & Answers for Success
Master Class 11 Chemistry: Engaging Questions & Answers for Success
Master Class 11 Social Science: Engaging Questions & Answers for Success
Master Class 11 Accountancy: Engaging Questions & Answers for Success
Trending doubts
Difference Between Prokaryotic Cells and Eukaryotic Cells
Two of the body parts which do not appear in MRI are class 11 biology CBSE
One Metric ton is equal to kg A 10000 B 1000 C 100 class 11 physics CBSE
10 examples of friction in our daily life
Draw a diagram of nephron and explain its structur class 11 biology CBSE
Draw a diagram of a plant cell and label at least eight class 11 biology CBSE