


How do you graph $y=\dfrac{5}{4}x+5$ ?
Answer
585.3k+ views
Hint: The equation of $y=mx+c$ is the equation of a straight line so the graph of $y=mx+c$ is a straight line where m is the slope of line and c is the y intercept of line that means the straight line cuts the Y axis at (c,0)
Complete step by step answer:
The given equation in the question $y=\dfrac{5}{4}x+5$
We know that $y=mx+c$ is a straight line where the slope is m and $y=\dfrac{5}{4}x+5$ is in the same format as $y=mx+c$ so we can say $y=\dfrac{5}{4}x+5$ is a straight line so the graph of $y=\dfrac{5}{4}x+5$ will be a straight line
Here we can see $\dfrac{5}{4}$ is in the place of m so the value of slope is $\dfrac{5}{4}$ and the value of y intercept is 5 that means the straight line passes through (5,0)
We can draw the graph any straight line by using 2 point, 2 points is enough to draw the graph of straight line
First locate any 2 points on the Cartesian plane and join the 2 points to extend the line. That's it, the graph of straight is ready.
So let choose any 2 point we already know one point that is y intercept (5,0) let take another point $\left( 1,\dfrac{25}{4} \right)$
Let’s locate above those points in Cartesian plane and join them
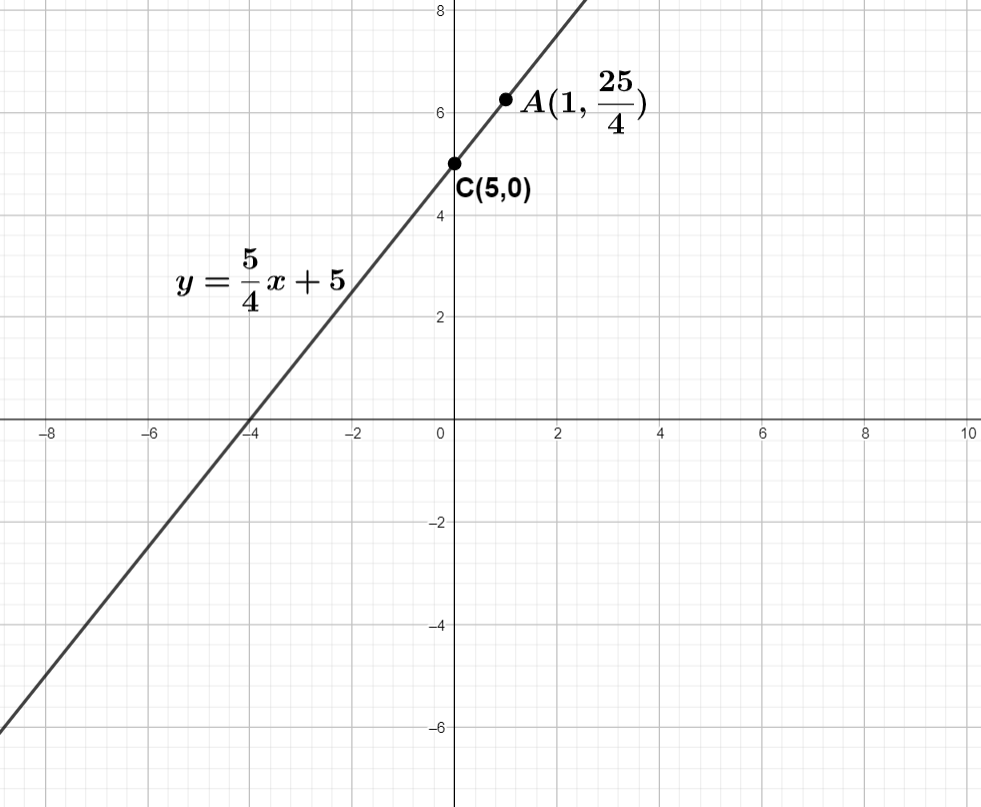
We can see C is the intercept and A is another point. We join the point and extend it . we got graph
Note:
The slope of the straight line $y=mx+c$ is m which is constant at all points. But if the equation of line is given in $ax+by+c=0$ where b is not equal to 0 then we can write it $y=-\dfrac{a}{b}x-\dfrac{c}{b}$ , now we can see the slope of the line is $-\dfrac{a}{b}$ and the y intercept is $-\dfrac{c}{b}$ where b is not equal to 0.
Complete step by step answer:
The given equation in the question $y=\dfrac{5}{4}x+5$
We know that $y=mx+c$ is a straight line where the slope is m and $y=\dfrac{5}{4}x+5$ is in the same format as $y=mx+c$ so we can say $y=\dfrac{5}{4}x+5$ is a straight line so the graph of $y=\dfrac{5}{4}x+5$ will be a straight line
Here we can see $\dfrac{5}{4}$ is in the place of m so the value of slope is $\dfrac{5}{4}$ and the value of y intercept is 5 that means the straight line passes through (5,0)
We can draw the graph any straight line by using 2 point, 2 points is enough to draw the graph of straight line
First locate any 2 points on the Cartesian plane and join the 2 points to extend the line. That's it, the graph of straight is ready.
So let choose any 2 point we already know one point that is y intercept (5,0) let take another point $\left( 1,\dfrac{25}{4} \right)$
Let’s locate above those points in Cartesian plane and join them
We can see C is the intercept and A is another point. We join the point and extend it . we got graph
Note:
The slope of the straight line $y=mx+c$ is m which is constant at all points. But if the equation of line is given in $ax+by+c=0$ where b is not equal to 0 then we can write it $y=-\dfrac{a}{b}x-\dfrac{c}{b}$ , now we can see the slope of the line is $-\dfrac{a}{b}$ and the y intercept is $-\dfrac{c}{b}$ where b is not equal to 0.
Recently Updated Pages
Master Class 11 English: Engaging Questions & Answers for Success
Master Class 11 Maths: Engaging Questions & Answers for Success
Class 11 Question and Answer - Your Ultimate Solutions Guide
Master Class 11 Biology: Engaging Questions & Answers for Success
Master Class 11 Physics: Engaging Questions & Answers for Success
Master Class 11 Accountancy: Engaging Questions & Answers for Success
Trending doubts
Differentiate between an exothermic and an endothermic class 11 chemistry CBSE
One Metric ton is equal to kg A 10000 B 1000 C 100 class 11 physics CBSE
In what year Guru Nanak Dev ji was born A15 April 1469 class 11 social science CBSE
Difference Between Prokaryotic Cells and Eukaryotic Cells
There are 720 permutations of the digits 1 2 3 4 5 class 11 maths CBSE
Draw a diagram of a plant cell and label at least eight class 11 biology CBSE