


How do you graph $y=\dfrac{2x}{x-1}$.
Answer
571.2k+ views
Hint: To draw the graph of $y=\dfrac{2x}{x-1}$, we will first find the horizontal and vertical asymptotic limit of the of the graph and then we will find the x-intercept and the y intercept and the extremum points of the graph and also we will check the concavity of the graph by the first derivative. If $\dfrac{dy}{dx}>0$ then the function will have increasing graph for the domain for which the first derivative is greater than 0, and if $\dfrac{dy}{dx}<0$ then the function will have decreasing graph for the domain for which the first derivative is less than 0.
Complete step by step answer:
We will first find the asymptotic limit of the function given. Asymptotes are the lines that a particular function can get very close to but never intersect.
We will first find the horizontal asymptotes of the function $y=\dfrac{2x}{x-1}$ . Horizontal asymptotes are parallel to the x-axis, we can obtain it by dividing the numerator and denominator by ‘x’ and then we will put $x=\infty $to get it.
$\Rightarrow y=\dfrac{2}{1-\dfrac{1}{x}}$
Now, we will put $x=\infty $, so that we can get the limit point of y.
$\Rightarrow y=\dfrac{2}{1-\dfrac{1}{\infty }}$
Now, we know that $\dfrac{1}{\infty }$ is almost equal to 0.
$\Rightarrow y={{2}^{+}}$ , ‘+’ at power means the number just greater than 2 i.e. 2.000000001
And, when we will put $x=-\infty $, we will get:
$\Rightarrow y={{2}^{-}}$, ‘-’ at power means the number just smaller than 2 i.e. 1.999999999
Now, we know that in $y=\dfrac{2x}{x-1}$, denominator can not be equal to 0, and we can see that it is zero for x = 1, so the line x = 1 is the vertical asymptote of the function $y=\dfrac{2x}{x-1}$.
Now, we will put $x={{1}^{+}}$, meaning a number just greater than 1 in the equal $y=\dfrac{2x}{x-1}$. We can see that the denominator is just greater than 0 so y will be equal to infinity i.e. $y=\infty $.
Now, when we put $x={{1}^{-}}$, means the number just less than 1, we will get $y=-\infty $, as the denominator of the function is just smaller than 0.
Now, we will check the concavity of the function by checking whether the first derivative is greater than or less than 0.
Now, we will find the y-intercept by putting x = 0.
$y=\dfrac{2\times 0}{0-1}=0$
So, when x = 0, we will get y = 0, so the graph will pass through the origin.
So, first derivative of the function $y=\dfrac{2x}{x-1}$ is given as:
$\dfrac{dy}{dx}=\dfrac{2\left( x-1 \right)-2x}{{{\left( x-1 \right)}^{2}}}$ , by quotient rule of differentiation.
$\Rightarrow \dfrac{dy}{dx}=\dfrac{-2}{{{\left( x-1 \right)}^{2}}}$
Since, we can see that $\dfrac{dy}{dx}<0$ as, denominator is always positive and the numerator is less than 0.
So, the concavity of the function is always decreasing.
At first, we will draw the horizontal asymptote y = 2 and the vertical asymptote x = 1.
Now, we know that the given function is decreasing function and for $y={{2}^{+}}$, we have $x=\infty $ and when $y={{2}^{-}}$, we have $x=-\infty $ and when $x={{1}^{+}}$ we have $y=\infty $and when $x={{1}^{-}}$ we have $y=-\infty $and we also know that graph passes through the origin. So, we will plot all these points on the graph and then join these points with free hand and decreasing concavity.
So, the required graph will be:
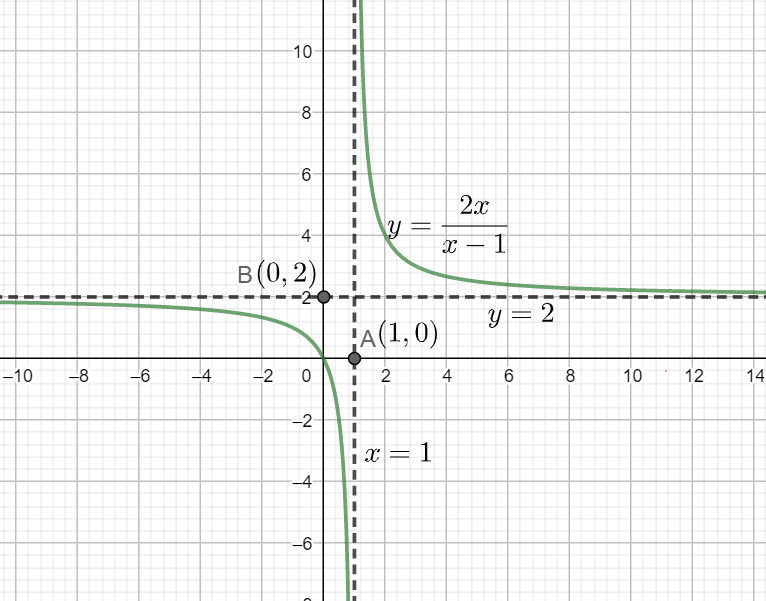
This is our required graph.
Note: Students are required to check the concavity of the graph before joining the plotted points otherwise they can plot the wrong concavity and get the wrong graph even if they have found every point, asymptotes correctly.
Complete step by step answer:
We will first find the asymptotic limit of the function given. Asymptotes are the lines that a particular function can get very close to but never intersect.
We will first find the horizontal asymptotes of the function $y=\dfrac{2x}{x-1}$ . Horizontal asymptotes are parallel to the x-axis, we can obtain it by dividing the numerator and denominator by ‘x’ and then we will put $x=\infty $to get it.
$\Rightarrow y=\dfrac{2}{1-\dfrac{1}{x}}$
Now, we will put $x=\infty $, so that we can get the limit point of y.
$\Rightarrow y=\dfrac{2}{1-\dfrac{1}{\infty }}$
Now, we know that $\dfrac{1}{\infty }$ is almost equal to 0.
$\Rightarrow y={{2}^{+}}$ , ‘+’ at power means the number just greater than 2 i.e. 2.000000001
And, when we will put $x=-\infty $, we will get:
$\Rightarrow y={{2}^{-}}$, ‘-’ at power means the number just smaller than 2 i.e. 1.999999999
Now, we know that in $y=\dfrac{2x}{x-1}$, denominator can not be equal to 0, and we can see that it is zero for x = 1, so the line x = 1 is the vertical asymptote of the function $y=\dfrac{2x}{x-1}$.
Now, we will put $x={{1}^{+}}$, meaning a number just greater than 1 in the equal $y=\dfrac{2x}{x-1}$. We can see that the denominator is just greater than 0 so y will be equal to infinity i.e. $y=\infty $.
Now, when we put $x={{1}^{-}}$, means the number just less than 1, we will get $y=-\infty $, as the denominator of the function is just smaller than 0.
Now, we will check the concavity of the function by checking whether the first derivative is greater than or less than 0.
Now, we will find the y-intercept by putting x = 0.
$y=\dfrac{2\times 0}{0-1}=0$
So, when x = 0, we will get y = 0, so the graph will pass through the origin.
So, first derivative of the function $y=\dfrac{2x}{x-1}$ is given as:
$\dfrac{dy}{dx}=\dfrac{2\left( x-1 \right)-2x}{{{\left( x-1 \right)}^{2}}}$ , by quotient rule of differentiation.
$\Rightarrow \dfrac{dy}{dx}=\dfrac{-2}{{{\left( x-1 \right)}^{2}}}$
Since, we can see that $\dfrac{dy}{dx}<0$ as, denominator is always positive and the numerator is less than 0.
So, the concavity of the function is always decreasing.
At first, we will draw the horizontal asymptote y = 2 and the vertical asymptote x = 1.
Now, we know that the given function is decreasing function and for $y={{2}^{+}}$, we have $x=\infty $ and when $y={{2}^{-}}$, we have $x=-\infty $ and when $x={{1}^{+}}$ we have $y=\infty $and when $x={{1}^{-}}$ we have $y=-\infty $and we also know that graph passes through the origin. So, we will plot all these points on the graph and then join these points with free hand and decreasing concavity.
So, the required graph will be:
This is our required graph.
Note: Students are required to check the concavity of the graph before joining the plotted points otherwise they can plot the wrong concavity and get the wrong graph even if they have found every point, asymptotes correctly.
Recently Updated Pages
Basicity of sulphurous acid and sulphuric acid are
Master Class 12 English: Engaging Questions & Answers for Success
Master Class 12 Social Science: Engaging Questions & Answers for Success
Master Class 12 Maths: Engaging Questions & Answers for Success
Master Class 12 Economics: Engaging Questions & Answers for Success
Master Class 12 Physics: Engaging Questions & Answers for Success
Trending doubts
Draw a labelled sketch of the human eye class 12 physics CBSE
Which are the Top 10 Largest Countries of the World?
Draw ray diagrams each showing i myopic eye and ii class 12 physics CBSE
Giving reasons state the signs positive or negative class 12 physics CBSE
Explain esterification reaction with the help of a class 12 chemistry CBSE
What is defined as a solenoid Depict a diagram with class 12 physics CBSE