


How do you graph $y - x = 0$?
Answer
569.4k+ views
Hint: The given equation is a linear equation. In order to draw a graph of a linear equation, firstly we assume some value of either of the variables, $x$ or $y$. Then we use these values by substituting them in the given linear equation. Next, we plot these points in the$x - y$plane. Then, we will have our required graph of the given linear equation.
Complete step by step answer:
The linear equation is $y - x = 0$.
We have to graph the given equation.
The given linear equation can be rewritten as: add variable $x$ on both sides of the equation, so that the variable $y$ gets isolated on the left-hand side of the equation and moreover, the equation is balanced at the same time.
$
\Rightarrow y - x + x = 0 + x \\
\Rightarrow y = x \\
$
From the above obtained equation, we can say that both $x$ and $y$ coordinates are equal.
To draw a graph, we need some points. Let’s find out some points by choosing different values of $x$.
If$x = 0$, then$y = 0$ (as $y = x$)
If$x = 2$, then$y = 2$ (as $y = x$)
If$x = - 2$, then$y = - 2$ (as $y = x$)
Now, we plot these three coordinates in the graph. Draw a straight line through these points.
Thus, this is our required graph.
Note: The graph of a linear equation is always a straight line. Students can check that the points found by them are correct or not by seeing if all the points obtained after calculations lie on a straight line or not. If not, then the points calculated are wrong. So, it is advised to do calculations carefully while finding out the points and plotting in $x - y$ plane.
Complete step by step answer:
The linear equation is $y - x = 0$.
We have to graph the given equation.
The given linear equation can be rewritten as: add variable $x$ on both sides of the equation, so that the variable $y$ gets isolated on the left-hand side of the equation and moreover, the equation is balanced at the same time.
$
\Rightarrow y - x + x = 0 + x \\
\Rightarrow y = x \\
$
From the above obtained equation, we can say that both $x$ and $y$ coordinates are equal.
To draw a graph, we need some points. Let’s find out some points by choosing different values of $x$.
If$x = 0$, then$y = 0$ (as $y = x$)
If$x = 2$, then$y = 2$ (as $y = x$)
If$x = - 2$, then$y = - 2$ (as $y = x$)
| $x$ | $0$ | $2$ | $ - 2$ |
| $y$ | $0$ | $2$ | $ - 2$ |
| Point | $\left( {0,0} \right)$ | $\left( {2,2} \right)$ | $\left( { - 2, - 2} \right)$ |
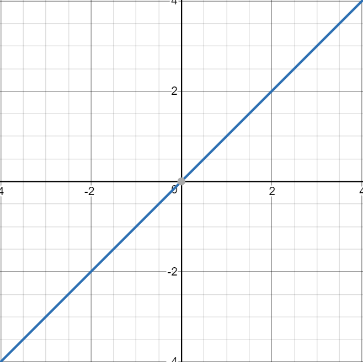
Now, we plot these three coordinates in the graph. Draw a straight line through these points.
Thus, this is our required graph.
Note: The graph of a linear equation is always a straight line. Students can check that the points found by them are correct or not by seeing if all the points obtained after calculations lie on a straight line or not. If not, then the points calculated are wrong. So, it is advised to do calculations carefully while finding out the points and plotting in $x - y$ plane.

Recently Updated Pages
Master Class 11 English: Engaging Questions & Answers for Success
Master Class 11 Maths: Engaging Questions & Answers for Success
Class 11 Question and Answer - Your Ultimate Solutions Guide
Master Class 11 Biology: Engaging Questions & Answers for Success
Master Class 11 Physics: Engaging Questions & Answers for Success
Master Class 11 Accountancy: Engaging Questions & Answers for Success
Trending doubts
Find the sum of series 1 + 2 + 3 + 4 + 5 + + 100 class 9 maths CBSE
Fill the blanks with the suitable prepositions 1 The class 9 english CBSE
Difference Between Plant Cell and Animal Cell
How many hours before the closure of election must class 9 social science CBSE
What is the Full Form of ICSE / ISC ?
What is pollution? How many types of pollution? Define it