


How do you graph $y = \ln (x + 3)$ ?
Answer
591.9k+ views
Hint: To draw this graph $y = \ln (x + 3)$ at first, we have to know about the graph $y = \ln x$ . Then we have to see the point of intersection of $y = \ln x$ with $x$ -axis. Then we have to shift this point three times left of the $x$ axis and find out the point of intersection with the $y$ -axis, then our work will be easy.
Complete step-by-step solution:
First, we have to draw the graph $y = \ln x$ .
For that, we have to take some values of $x$ coordinate and find out the values of $y$ .
Let us take the values $0$ , $1$ , $e$ ( a specific number lies between $2$ and $3$ ; the value is approximate to $\;2.718$ ), $2$ and $5$ of $x$ .
Now we will find the values of $y$-axis for these values.
At $x = 0$ ;
From the equation $y = \ln x$ we will get;
$y = \ln 0$
$\Rightarrow y = \infty$
At $x = 1$ ;
From the equation $y = \ln x$ we will get;
$y = \ln 1$
$\Rightarrow y = 0$
At $x = e$ ;
From the equation $y = \ln x$ we will get;
$y = \ln e$
We know that $\ln e = 1$ .
$\Rightarrow y = 1$
At $x = 2$ ;
From the equation $y = \ln x$ we will get;
$y = \ln 2$
$\Rightarrow y = 0.693$
At $x = 5$ ;
From the equation $y = \ln x$ we will get;
$y = \ln 5$
$\Rightarrow y = 1.609$
Now we will plot these points $(0,\infty )$ , $(1,0)$ , $(e,1)$ , $(2,0.693)$ and $(5,1.609)$ in the two-dimensional coordinate system and we will get the graph of $y = \ln x$ .
To draw $y = \ln (x + 3)$ we just have to shift each point in the $x$ axis and then we can easily get the values of $y$ -axis. We will get the points $( - 3,\infty )$ , $( - 2,0)$ , $(e - 3,1)$ , $( - 1,0.693)$ and $(2,1.609)$ .
Now we will put these points and finally get;
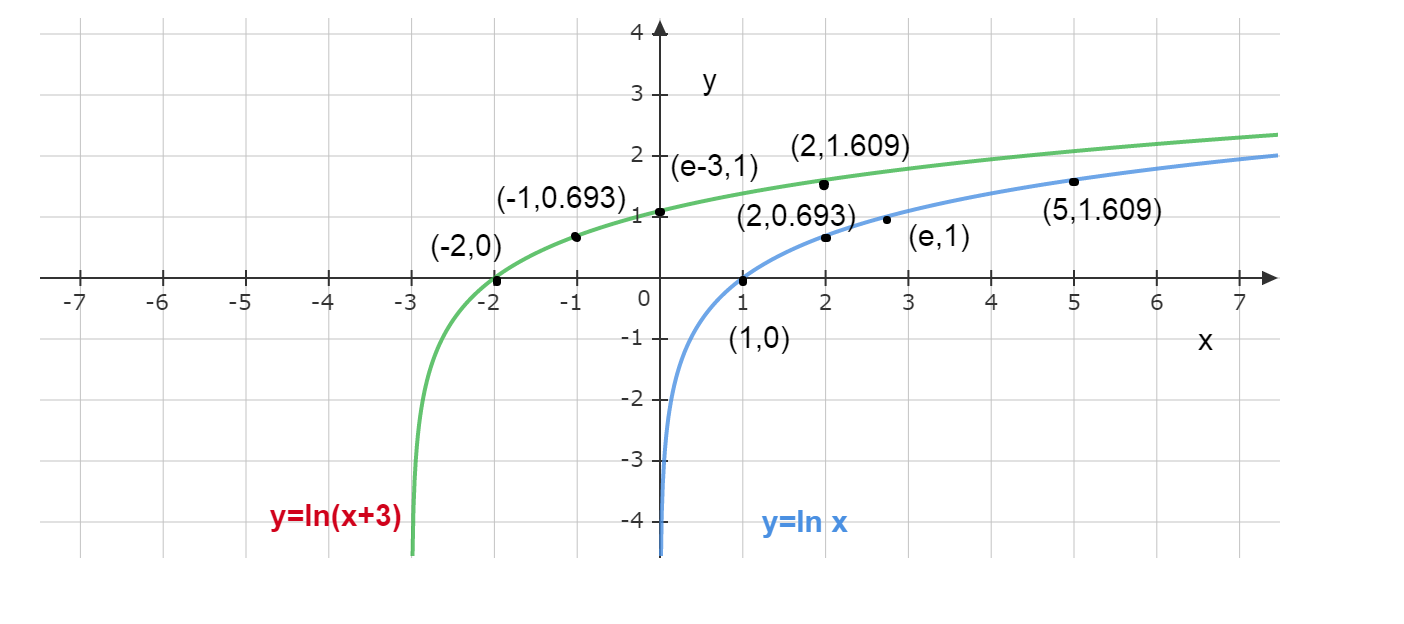
Here clearly $(0,\infty )$ and $( - 3,\infty )$ give the lower part of the graphs.
Note: Whenever we have this kind of plotting question at first we will try to find the nearest known function. Students should always be careful that $(0,\infty )$ and $( - 3,\infty )$ can’t be plotted. They only imply that the value of $x$ the graph will tend to infinity which means a never-ending end of the value of $y$ -axis.
Complete step-by-step solution:
First, we have to draw the graph $y = \ln x$ .
For that, we have to take some values of $x$ coordinate and find out the values of $y$ .
Let us take the values $0$ , $1$ , $e$ ( a specific number lies between $2$ and $3$ ; the value is approximate to $\;2.718$ ), $2$ and $5$ of $x$ .
Now we will find the values of $y$-axis for these values.
At $x = 0$ ;
From the equation $y = \ln x$ we will get;
$y = \ln 0$
$\Rightarrow y = \infty$
At $x = 1$ ;
From the equation $y = \ln x$ we will get;
$y = \ln 1$
$\Rightarrow y = 0$
At $x = e$ ;
From the equation $y = \ln x$ we will get;
$y = \ln e$
We know that $\ln e = 1$ .
$\Rightarrow y = 1$
At $x = 2$ ;
From the equation $y = \ln x$ we will get;
$y = \ln 2$
$\Rightarrow y = 0.693$
At $x = 5$ ;
From the equation $y = \ln x$ we will get;
$y = \ln 5$
$\Rightarrow y = 1.609$
Now we will plot these points $(0,\infty )$ , $(1,0)$ , $(e,1)$ , $(2,0.693)$ and $(5,1.609)$ in the two-dimensional coordinate system and we will get the graph of $y = \ln x$ .
To draw $y = \ln (x + 3)$ we just have to shift each point in the $x$ axis and then we can easily get the values of $y$ -axis. We will get the points $( - 3,\infty )$ , $( - 2,0)$ , $(e - 3,1)$ , $( - 1,0.693)$ and $(2,1.609)$ .
Now we will put these points and finally get;
Here clearly $(0,\infty )$ and $( - 3,\infty )$ give the lower part of the graphs.
Note: Whenever we have this kind of plotting question at first we will try to find the nearest known function. Students should always be careful that $(0,\infty )$ and $( - 3,\infty )$ can’t be plotted. They only imply that the value of $x$ the graph will tend to infinity which means a never-ending end of the value of $y$ -axis.
Recently Updated Pages
Master Class 12 Economics: Engaging Questions & Answers for Success
Master Class 12 English: Engaging Questions & Answers for Success
Master Class 12 Social Science: Engaging Questions & Answers for Success
Master Class 12 Maths: Engaging Questions & Answers for Success
Master Class 12 Physics: Engaging Questions & Answers for Success
Master Class 9 General Knowledge: Engaging Questions & Answers for Success
Trending doubts
Which are the Top 10 Largest Countries of the World?
Draw a labelled sketch of the human eye class 12 physics CBSE
Differentiate between homogeneous and heterogeneous class 12 chemistry CBSE
Why is the cell called the structural and functional class 12 biology CBSE
Draw ray diagrams each showing i myopic eye and ii class 12 physics CBSE
Which is the correct genotypic ratio of mendel dihybrid class 12 biology CBSE