


How do you graph $y = - 9x$?
Answer
574.8k+ views
Hint: First, we have to make the given linear equation in Slope-intercept form and then calculate the value of $y$ for any two arbitrary values of $x$. Next make a table of these values of $x$ and $y$. Next plot the obtained points on the graph paper and draw a line passing through these points.
Slope Intercept form of a line:
The equation of a line with slope $m$ and making an intercept $c$ on $y$-axis is $y = mx + c$.
Complete step by step solution:
Given linear equation in two variables: $y = - 9x$
First, we have to make the given linear equation in Slope-intercept form.
Here, the equation is already in Slope-intercept form.
Now, we have to calculate the value of $y$ for any two arbitrary values of $x$. Thus, finding the value of $y$ when $x = 0$ and $x = 1$.
When $x = 0$, $y = - 9 \times 0 = 0$
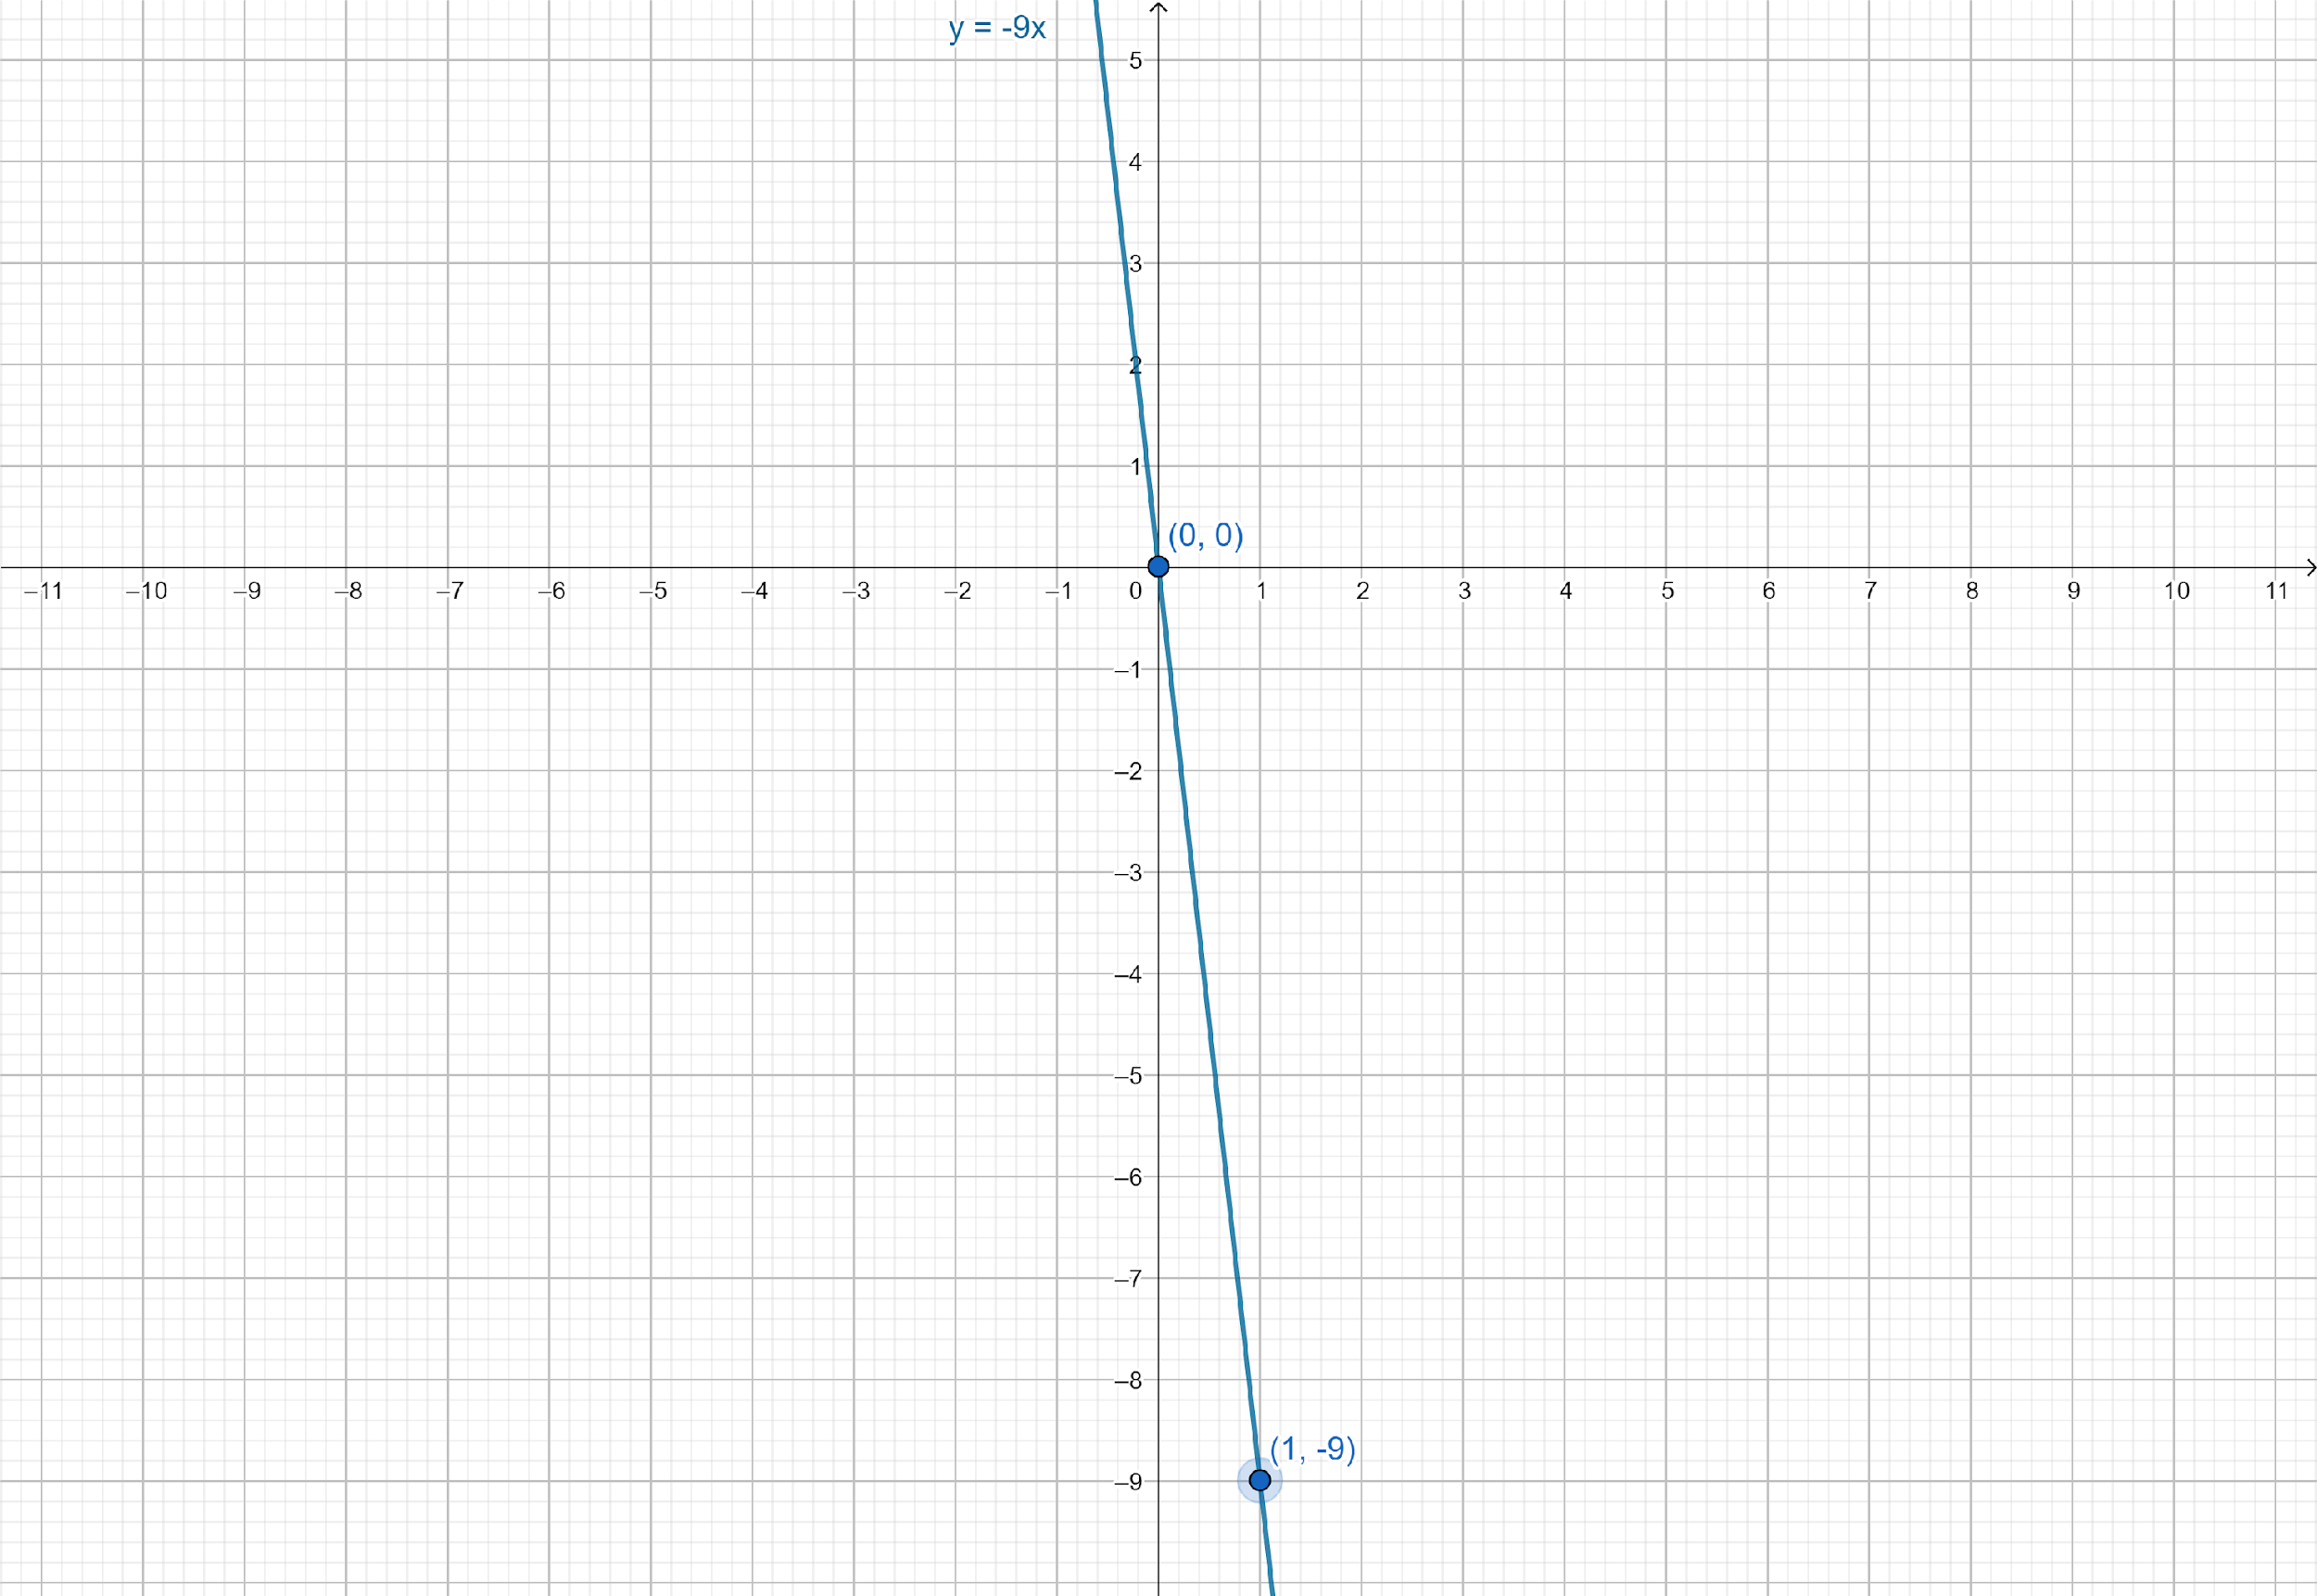
When $x = 1$, $y = - 9 \times 1 = - 9$
Now we have to make a table of these values of $x$ and $y$.
Now we have to plot the points $A\left( {0,0} \right)$ and $B\left( {1, - 9} \right)$ on the graph paper and draw a line passing through $A$ and $B$.
Note: Method to draw the graph of linear equation in two variables:
Step I: Write a given linear equation and express y in terms of x.
Step II: Put different values of x and find the corresponding value of y.
Step III: Form a table by writing the values of y below the corresponding values of x.
Step IV: Plot these points on graph paper.
Step V: Join these points. Thus, we get a straight line and produce it on both sides.
Slope Intercept form of a line:
The equation of a line with slope $m$ and making an intercept $c$ on $y$-axis is $y = mx + c$.
Complete step by step solution:
Given linear equation in two variables: $y = - 9x$
First, we have to make the given linear equation in Slope-intercept form.
Here, the equation is already in Slope-intercept form.
Now, we have to calculate the value of $y$ for any two arbitrary values of $x$. Thus, finding the value of $y$ when $x = 0$ and $x = 1$.
When $x = 0$, $y = - 9 \times 0 = 0$
When $x = 1$, $y = - 9 \times 1 = - 9$
Now we have to make a table of these values of $x$ and $y$.
| $x$ | $0$ | $1$ |
| $y$ | $0$ | $ - 9$ |
Now we have to plot the points $A\left( {0,0} \right)$ and $B\left( {1, - 9} \right)$ on the graph paper and draw a line passing through $A$ and $B$.
Note: Method to draw the graph of linear equation in two variables:
Step I: Write a given linear equation and express y in terms of x.
Step II: Put different values of x and find the corresponding value of y.
Step III: Form a table by writing the values of y below the corresponding values of x.
Step IV: Plot these points on graph paper.
Step V: Join these points. Thus, we get a straight line and produce it on both sides.
Recently Updated Pages
Master Class 9 General Knowledge: Engaging Questions & Answers for Success
Master Class 9 Maths: Engaging Questions & Answers for Success
Master Class 9 Science: Engaging Questions & Answers for Success
Master Class 9 English: Engaging Questions & Answers for Success
Master Class 9 Social Science: Engaging Questions & Answers for Success
Class 9 Question and Answer - Your Ultimate Solutions Guide
Trending doubts
What is the situation called when no party gets the class 9 social science CBSE
Find the sum of series 1 + 2 + 3 + 4 + 5 + + 100 class 9 maths CBSE
Difference Between Plant Cell and Animal Cell
Fill the blanks with the suitable prepositions 1 The class 9 english CBSE
What is pollution? How many types of pollution? Define it
What is the Full Form of ICSE / ISC ?