


How do you graph $y = 4 - 3x?$
Answer
567.3k+ views
Hint: First find a few random points from which the given line is passing by putting random values of the independent variable (x) in the given equation, to get the values of the dependent variable (y). Go for smaller values like $0,\;1,\;2,$ etc, larger values will make the graph a bit complicated to take its scale and in plotting it. And when plotting the graph, take the scale in between $1\;{\text{to}}\;5$, don’t take large scales.
Complete step by step solution:
In order to graph the equation $y = 4 - 3x$, firstly we have to find some values of $x\;{\text{and}}\;y$, we will put some values of $x$ in the equation and then get respective values of $y$
For this we will create a table in which we will write the values of $x,\;y$ and the coordinates of points we will get, creating the table below.
Now, you can see in the table, how we have calculated the value of $y$ by putting random values of $x$ in the above equation. Now, we have the three co-ordinates of the required graph, i.e.$(0,\;4),\;(1,\;1),\;( - 1,\;7)\;{\text{and}}\;(2,\; - 2)$. So, we will now plot these three points on the graph as follows
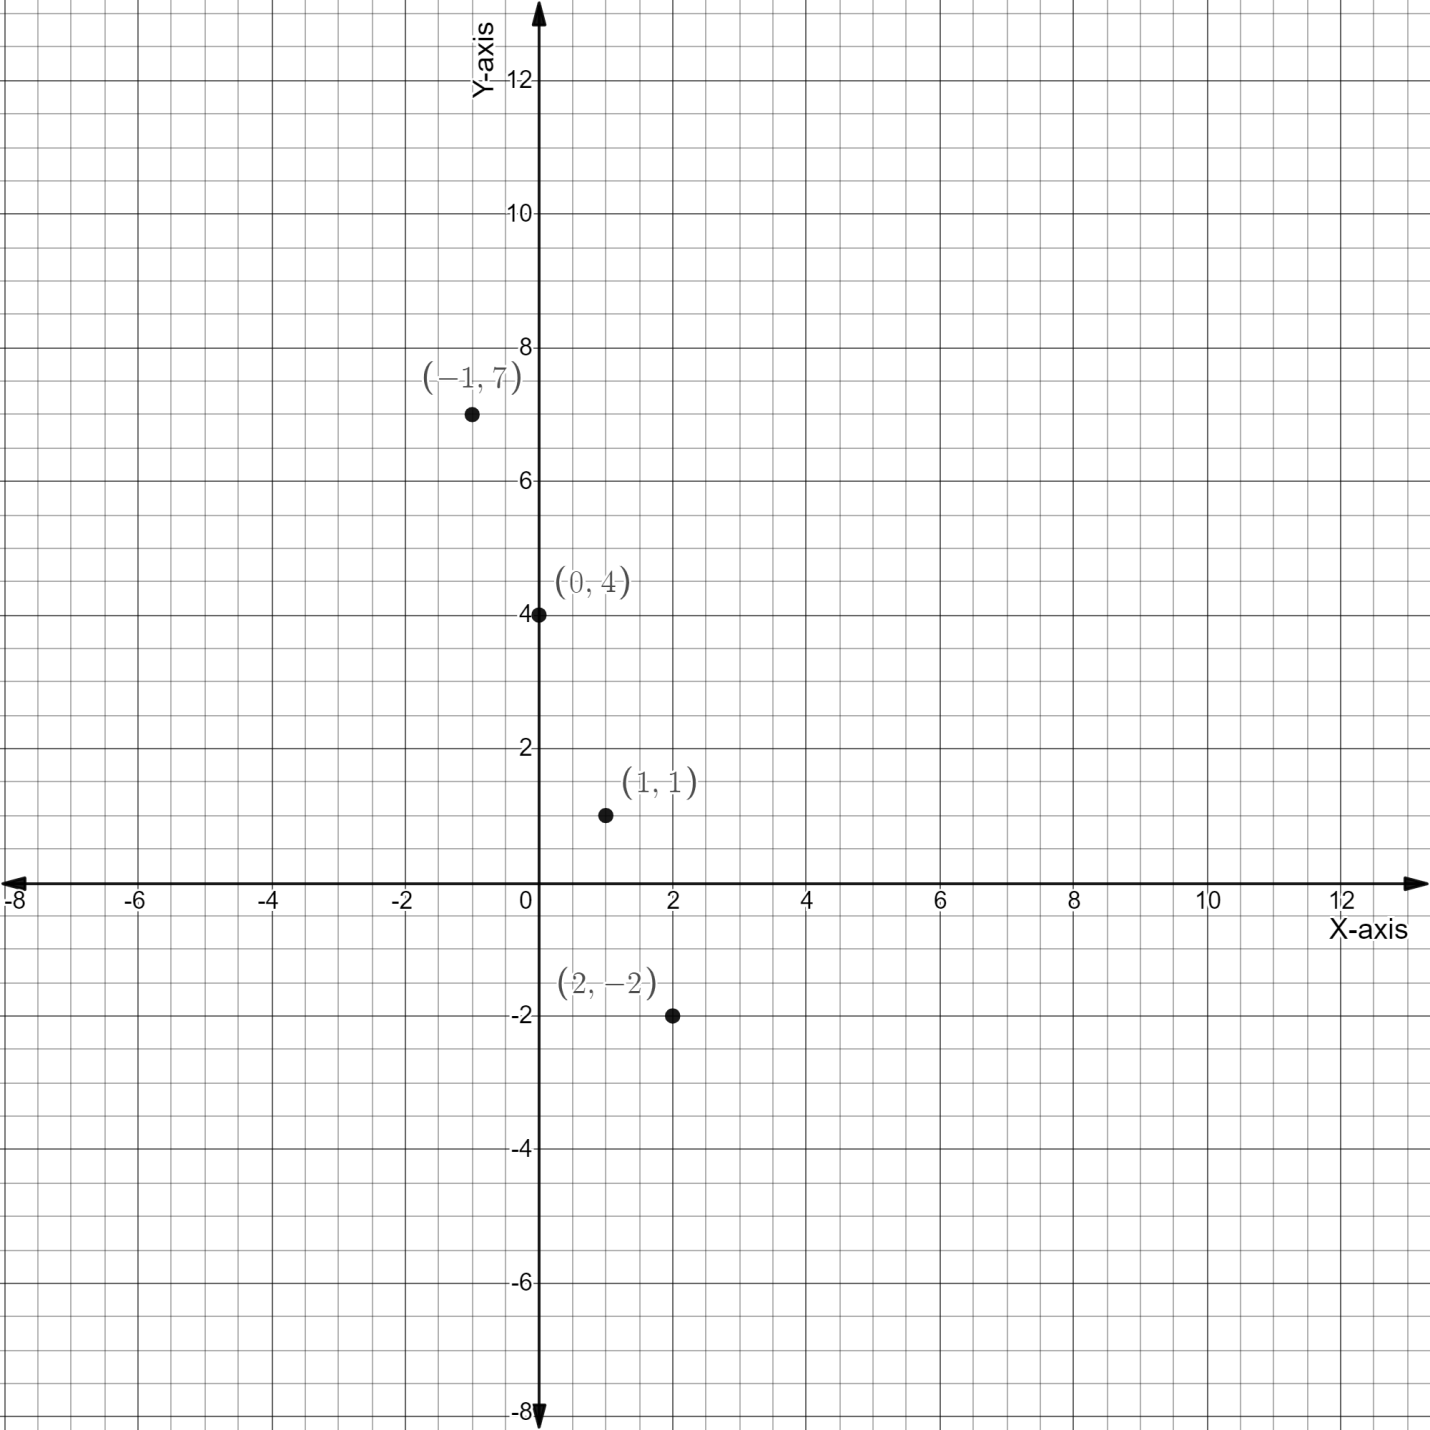
So, we have plotted all the points on the graph, now we have to draw a line passing through these points to get the required graph of the equation, we will get
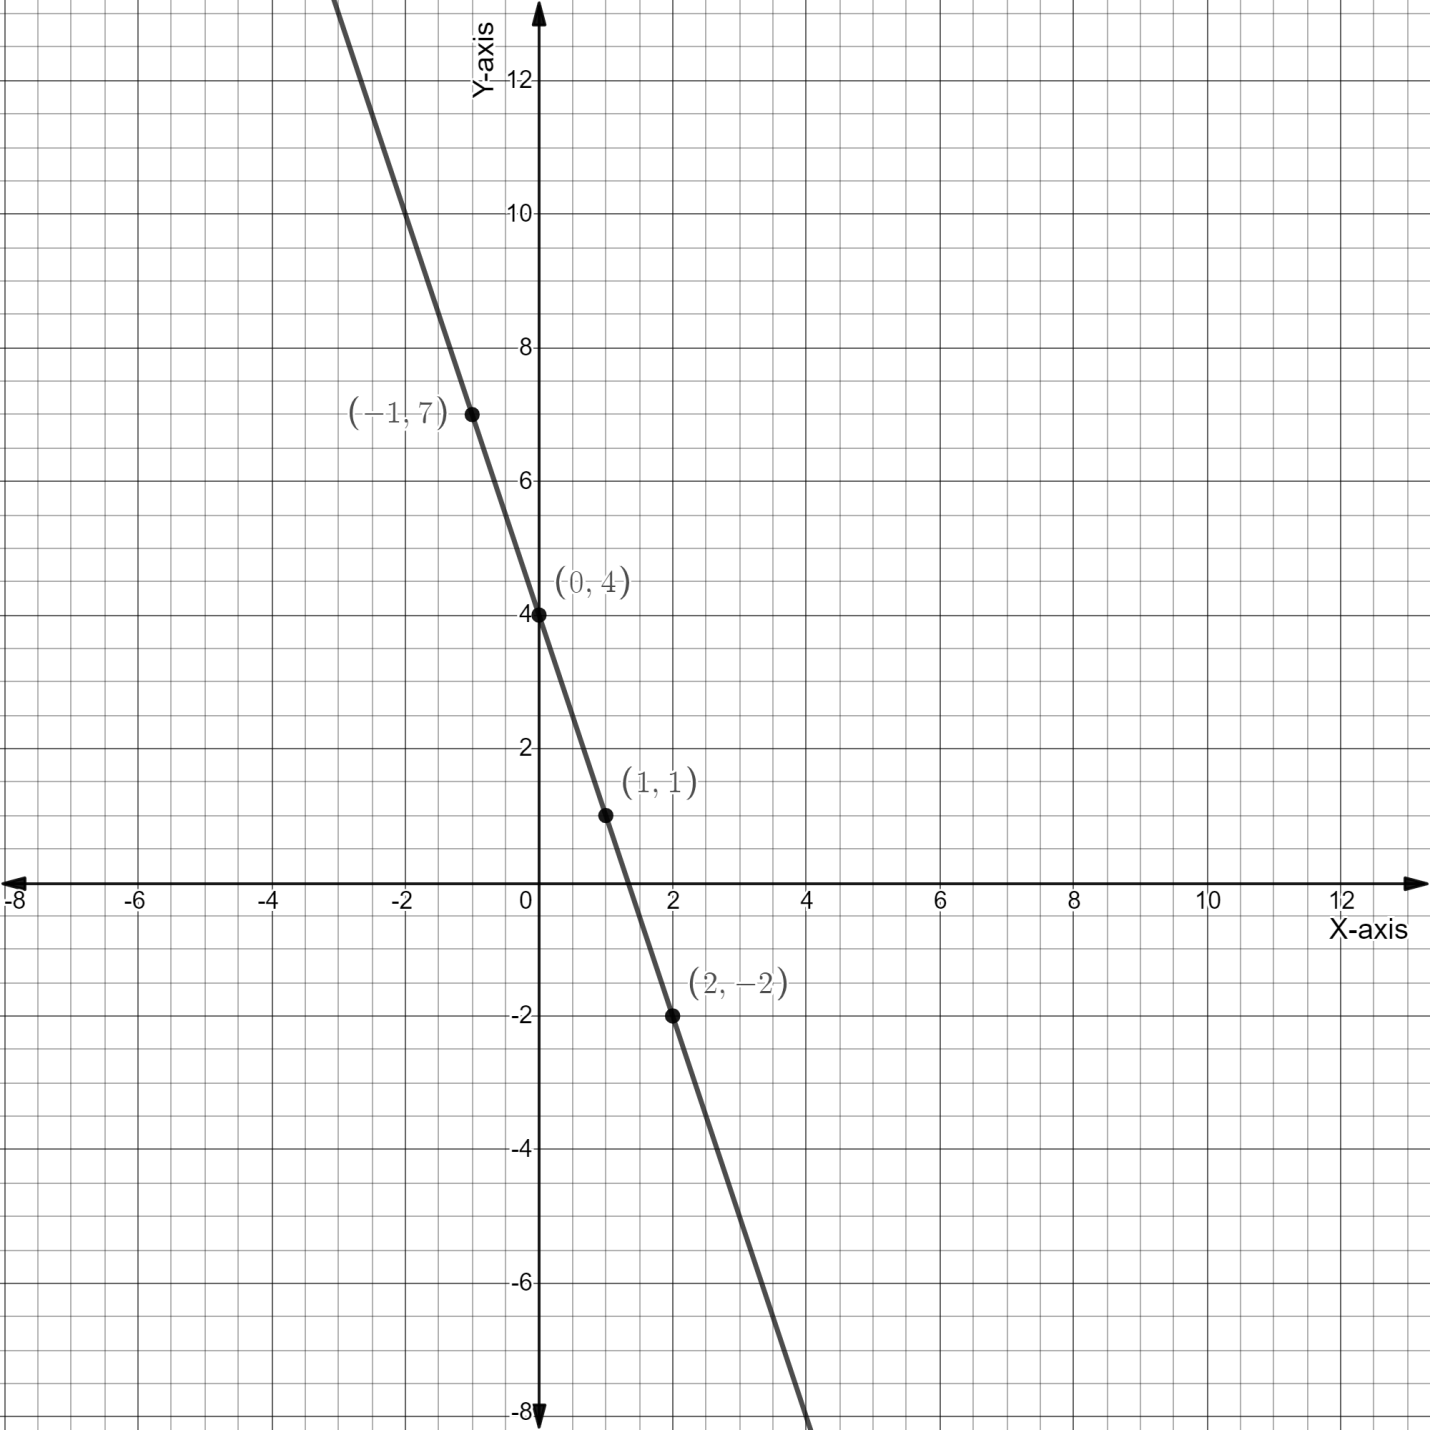
This is the required graph of the equation $y = 4 - 3x$
Note: When finding the passing points of the line find points which have reasonable distance to each other so that taking the scale of the graph will become easy. You can plot the graph directly by finding its intercepts.
Complete step by step solution:
In order to graph the equation $y = 4 - 3x$, firstly we have to find some values of $x\;{\text{and}}\;y$, we will put some values of $x$ in the equation and then get respective values of $y$
For this we will create a table in which we will write the values of $x,\;y$ and the coordinates of points we will get, creating the table below.
| Random values of $x$ | Value of $y = 4 - 3x$ | Coordinates(x, y) |
| $0$ | $y = 4 - 3 \times 0 = 4 - 0 = 4$ | $(0,\;4)$ |
| $1$ | $y = 4 - 3 \times 1 = 4 - 3 = 1$ | $(1,\;1)$ |
| $ - 1$ | $y = 4 - 3 \times ( - 1) = 4 + 3 = 7$ | $( - 1,\;7)$ |
| $2$ | $y = 4 - 3 \times 2 = 4 - 6 = - 2$ | $(2,\; - 2)$ |
Now, you can see in the table, how we have calculated the value of $y$ by putting random values of $x$ in the above equation. Now, we have the three co-ordinates of the required graph, i.e.$(0,\;4),\;(1,\;1),\;( - 1,\;7)\;{\text{and}}\;(2,\; - 2)$. So, we will now plot these three points on the graph as follows
So, we have plotted all the points on the graph, now we have to draw a line passing through these points to get the required graph of the equation, we will get
This is the required graph of the equation $y = 4 - 3x$
Note: When finding the passing points of the line find points which have reasonable distance to each other so that taking the scale of the graph will become easy. You can plot the graph directly by finding its intercepts.

Recently Updated Pages
Master Class 10 Computer Science: Engaging Questions & Answers for Success
Master Class 10 General Knowledge: Engaging Questions & Answers for Success
Master Class 10 English: Engaging Questions & Answers for Success
Master Class 10 Social Science: Engaging Questions & Answers for Success
Master Class 10 Maths: Engaging Questions & Answers for Success
Master Class 10 Science: Engaging Questions & Answers for Success
Trending doubts
Find the sum of series 1 + 2 + 3 + 4 + 5 + + 100 class 9 maths CBSE
Fill the blanks with the suitable prepositions 1 The class 9 english CBSE
Difference Between Plant Cell and Animal Cell
What is pollution? How many types of pollution? Define it
Name 10 Living and Non living things class 9 biology CBSE
Write the 6 fundamental rights of India and explain in detail