


How do you graph $y = 3.5x$
Answer
583.8k+ views
Hint: Given a linear equation and we have to plot a graph of the linear equation. To plot the graph of the equation, first, we will find the value of the variable $y$ for different values of the variable $x$. Then the set of these values can be plotted on the set of axes. Then we will join the points to obtain the graph of the linear equation.
Complete step-by-step answer:
We are given the linear equation $y = 3.5x$. Substitute $x = - 2$ into the linear equation to determine the value of $y$.
$y = 3.5\left( { - 2} \right)$
On simplifying the equation, we get:
$ \Rightarrow y = - 7$
Now we will substitute $x = - 1$ into the linear equation to determine the value of $y$.
$y = 3.5\left( { - 1} \right)$
On simplifying the equation, we get:
$ \Rightarrow y = - 3.5$
Now we will substitute $x = 0$ into the linear equation to determine the value of $y$.
$y = 3.5\left( 0 \right)$
On simplifying the equation, we get:
$ \Rightarrow y = 0$
Then we will substitute $x = 1$ into the linear equation to determine the value of $y$.
$y = 3.5\left( 1 \right)$
On simplifying the equation, we get:
$ \Rightarrow y = 3.5$
Now we will plot the points on the set of $x$-axis and $y$-axis. Then join these points to obtain the graph of the linear equation.
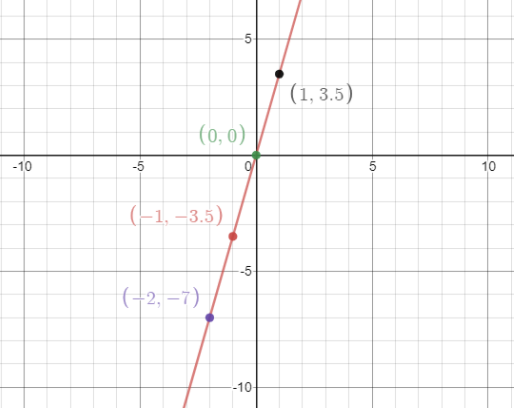
Final answer: Hence the graph of the linear equation is
Note:
In such types of questions students mainly make mistakes while plotting the points on the set of axes. In an ordered pair (x,y), the value of x is the distance of the point from y-axis whereas the value of y is plotted by taking the distance from the x-axis. In such types of questions, the graph of the linear equation is obtained by plotting these points and must be in a straight line.
Complete step-by-step answer:
We are given the linear equation $y = 3.5x$. Substitute $x = - 2$ into the linear equation to determine the value of $y$.
$y = 3.5\left( { - 2} \right)$
On simplifying the equation, we get:
$ \Rightarrow y = - 7$
Now we will substitute $x = - 1$ into the linear equation to determine the value of $y$.
$y = 3.5\left( { - 1} \right)$
On simplifying the equation, we get:
$ \Rightarrow y = - 3.5$
Now we will substitute $x = 0$ into the linear equation to determine the value of $y$.
$y = 3.5\left( 0 \right)$
On simplifying the equation, we get:
$ \Rightarrow y = 0$
Then we will substitute $x = 1$ into the linear equation to determine the value of $y$.
$y = 3.5\left( 1 \right)$
On simplifying the equation, we get:
$ \Rightarrow y = 3.5$
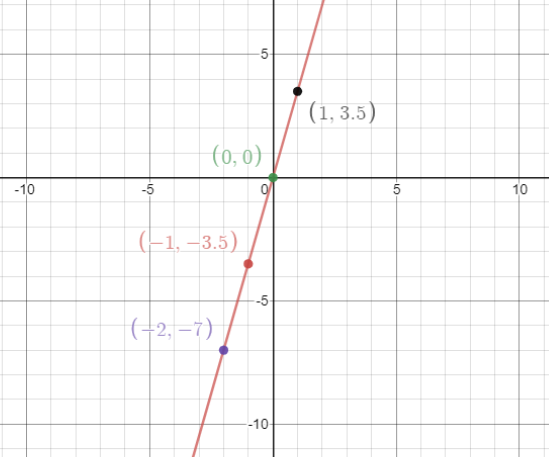
Now we will plot the points on the set of $x$-axis and $y$-axis. Then join these points to obtain the graph of the linear equation.
Final answer: Hence the graph of the linear equation is
Note:
In such types of questions students mainly make mistakes while plotting the points on the set of axes. In an ordered pair (x,y), the value of x is the distance of the point from y-axis whereas the value of y is plotted by taking the distance from the x-axis. In such types of questions, the graph of the linear equation is obtained by plotting these points and must be in a straight line.
Recently Updated Pages
Master Class 11 English: Engaging Questions & Answers for Success
Master Class 11 Maths: Engaging Questions & Answers for Success
Class 11 Question and Answer - Your Ultimate Solutions Guide
Master Class 11 Biology: Engaging Questions & Answers for Success
Master Class 11 Physics: Engaging Questions & Answers for Success
Master Class 11 Accountancy: Engaging Questions & Answers for Success
Trending doubts
Differentiate between an exothermic and an endothermic class 11 chemistry CBSE
One Metric ton is equal to kg A 10000 B 1000 C 100 class 11 physics CBSE
In what year Guru Nanak Dev ji was born A15 April 1469 class 11 social science CBSE
Difference Between Prokaryotic Cells and Eukaryotic Cells
Draw a diagram of a plant cell and label at least eight class 11 biology CBSE
1 Quintal is equal to a 110 kg b 10 kg c 100kg d 1000 class 11 physics CBSE