


How do you graph $y = 2x - 2?$
Answer
581.7k+ views
Hint: Whenever they ask us to draw a graph for a straight line equation we need to have a minimum of two points, it may be intercept points or any other point. We can get the points by substituting or assuming different values for $x$ and finding the corresponding values of $y$. By using these points we can plot the graph for the given equation.
Complete step-by-step answer:
The given equation $y = 2x - 2$ is a straight line equation, where we need to have a minimum of two points to plot a graph. The two points may be intercepts that are x-intercept and y-intercept which means x-intercept is a point which passes the x-axis at $y = 0$ and y-intercept is a point which passes the y-axis at $x = 0$. We can also find the point by taking different values for $x$ and finding the corresponding values of $y$ by substituting back in the equation.
Now, we find the y-intercept by putting $x = 0$ in the equation $y = 2x - 2$
Therefore we get, $y = 2 \times 0 - 2$
$ \Rightarrow y = - 2$ at $x = 0$
Now, we find the x-intercept by putting $y = 0$ in the equation $y = 2x - 2$
Therefore we get, $0 = 2x - 2$
$ \Rightarrow 2x = 2$
$ \Rightarrow x = 1$ at $y = 0$
For better understanding we take some more points for $x$ and find the corresponding values of $y$.
Let us substitute $x = 1$ in the equation $y = 2x - 2$, we get
$y = 2 \times 1 - 2$
$ \Rightarrow y = 2 - 2 = 0$ which is the same as x-intercept.
Now, substitute $x = 2$ in the equation $y = 2x - 2$, we get
$y = 2 \times 2 - 2$
$ \Rightarrow y = 4 - 2 = 2$
So now we have points which are enough to draw a graph.
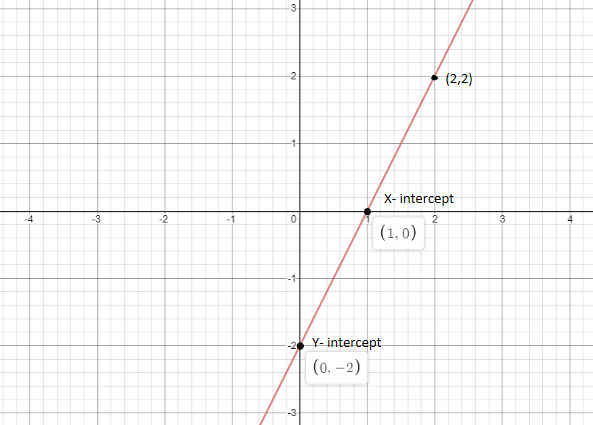
Plot the graph for the points, $(0, - 2)$ , $(1,0)$ , $(2,2)$ .
The graph for the above points is as shown below:
Note: Whenever they ask us to draw a graph by giving an equation, then just assume values for one unknown that is $x$ and find the corresponding values of another unknown that is $y$. Plot the same on a graph sheet. We require a minimum of two points to draw a graph but for your understanding try to take some more points and draw as the graph as per the points.
Complete step-by-step answer:
The given equation $y = 2x - 2$ is a straight line equation, where we need to have a minimum of two points to plot a graph. The two points may be intercepts that are x-intercept and y-intercept which means x-intercept is a point which passes the x-axis at $y = 0$ and y-intercept is a point which passes the y-axis at $x = 0$. We can also find the point by taking different values for $x$ and finding the corresponding values of $y$ by substituting back in the equation.
Now, we find the y-intercept by putting $x = 0$ in the equation $y = 2x - 2$
Therefore we get, $y = 2 \times 0 - 2$
$ \Rightarrow y = - 2$ at $x = 0$
Now, we find the x-intercept by putting $y = 0$ in the equation $y = 2x - 2$
Therefore we get, $0 = 2x - 2$
$ \Rightarrow 2x = 2$
$ \Rightarrow x = 1$ at $y = 0$
For better understanding we take some more points for $x$ and find the corresponding values of $y$.
Let us substitute $x = 1$ in the equation $y = 2x - 2$, we get
$y = 2 \times 1 - 2$
$ \Rightarrow y = 2 - 2 = 0$ which is the same as x-intercept.
Now, substitute $x = 2$ in the equation $y = 2x - 2$, we get
$y = 2 \times 2 - 2$
$ \Rightarrow y = 4 - 2 = 2$
So now we have points which are enough to draw a graph.
Plot the graph for the points, $(0, - 2)$ , $(1,0)$ , $(2,2)$ .
The graph for the above points is as shown below:
Note: Whenever they ask us to draw a graph by giving an equation, then just assume values for one unknown that is $x$ and find the corresponding values of another unknown that is $y$. Plot the same on a graph sheet. We require a minimum of two points to draw a graph but for your understanding try to take some more points and draw as the graph as per the points.

Recently Updated Pages
Master Class 11 English: Engaging Questions & Answers for Success
Master Class 11 Maths: Engaging Questions & Answers for Success
Class 11 Question and Answer - Your Ultimate Solutions Guide
Master Class 11 Biology: Engaging Questions & Answers for Success
Master Class 11 Physics: Engaging Questions & Answers for Success
Master Class 11 Accountancy: Engaging Questions & Answers for Success
Trending doubts
Find the sum of series 1 + 2 + 3 + 4 + 5 + + 100 class 9 maths CBSE
Fill the blanks with the suitable prepositions 1 The class 9 english CBSE
Difference Between Plant Cell and Animal Cell
How many hours before the closure of election must class 9 social science CBSE
What is the Full Form of ICSE / ISC ?
What is pollution? How many types of pollution? Define it