


How do you graph \[y + 4x = 1?\]
Answer
572.1k+ views
Hint: According to the question we have to determine the graph of the linear expression which is as given in the question is \[y + 4x = 1\]. So, First of all we have to substitute the different values of x and find the value of y for the different values of x. Same as we can substitute the values of y to obtain the values of x.
Now, we have to substitute the value $x = - 1$ in the linear expression \[y + 4x = 1\] which is as mentioned in the question.
Hence, on substituting the value $x = - 1$ in the expression we will obtain the two points to which we have to plot in the graph.
Now, we have to substitute the value of $x = 0$ in the linear expression \[y + 4x = 1\] which is as mentioned in the question.
Hence, on substituting the value $x = 0$ in the expression we will obtain the two points to which we have to plot in the graph.
Now, we have to substitute the value $x = 1$ in the linear expression \[y + 4x = 1\] which is as mentioned in the question.
Hence, on substituting the value $x = 1$ in the expression we will obtain the two points to which we have to plot in the graph.
Complete step-by-step solution:
Step 1: First of all we have to substitute the different values of x and find the value of y for the different values of x and same as we can substitute the values of y to obtain the values of x as mentioned in the solution hint.
Step 2: Now, we have to substitute the value $x = - 1$ in the linear expression \[y + 4x = 1\] which is as mentioned in the question. Hence,
$
\Rightarrow y + 4( - 1) = 1 \\
\Rightarrow y = 1 + 4 \\
\Rightarrow y = 5
$
Hence, on substituting the value $x = - 1$ in the expression we will obtain the two points to which we have to plot in the graph which are as below:
$ \Rightarrow A(x,y) = ( - 1,5)$
Step 3: Now, we have to substitute the value $x = 0$ in the linear expression \[y + 4x = 1\] which is as mentioned in the question. Hence,
$
\Rightarrow y + 4(0) = 1 \\
\Rightarrow y = 1
$
Hence, on substituting the value $x = 0$ in the expression we will obtain the two points to which we have to plot in the graph which are as below:
$ \Rightarrow B(x,y) = (0,1)$
Step 4: Now, we have to substitute the value $x = 1$ in the linear expression \[y + 4x = 1\] which is as mentioned in the question. Hence,
$
\Rightarrow y + 4(1) = 1 \\
\Rightarrow y = 1 - 4 \\
\Rightarrow y = - 3
$
Hence, on substituting the value $x = 1$ in the expression we will obtain the two points to which we have to plot in the graph which are as below:
$ \Rightarrow C(x,y) = (1, - 3)$
Step 5: Now, we have to substitute the value $x = 1$ in the linear expression \[y + 4x = 1\] which is as mentioned in the question. Hence,
$
\Rightarrow y + 4(1) = 1 \\
\Rightarrow y = 1 - 4 \\
\Rightarrow y = - 3
$
Hence, on substituting the value $x = 1$ in the expression we will obtain the two points to which we have to plot in the graph which are as below:
$ \Rightarrow C(x,y) = (1, - 3)$
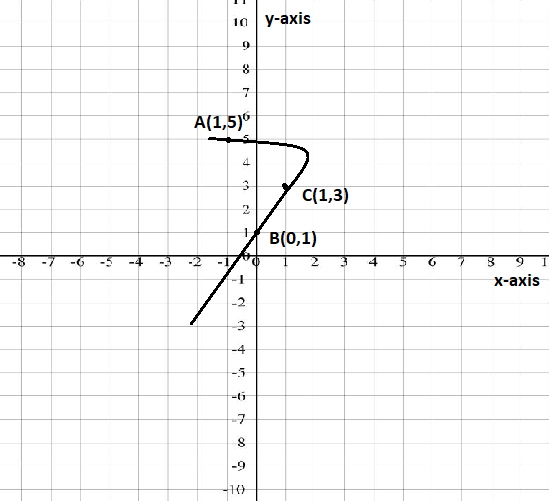
Step 6: Now, with the help of the points A, B and C which we have obtained in the previous steps we have to determine the line graph which is as below:

Hence, with the help of the points A, B and C we have determine the graph of the line \[y + 4x = 1\] which is as below:
Note: To obtain the points it is necessary that we have to determine the values of y for the given expression which can be determined by placing the value of x as (-1,0,1) to obtain the value of y or vice-versa.
To obtain the graph it is necessary that we have to plot the points in the quadrant as $ \pm $ x-axis and $ \pm $ y-axis.
Now, we have to substitute the value $x = - 1$ in the linear expression \[y + 4x = 1\] which is as mentioned in the question.
Hence, on substituting the value $x = - 1$ in the expression we will obtain the two points to which we have to plot in the graph.
Now, we have to substitute the value of $x = 0$ in the linear expression \[y + 4x = 1\] which is as mentioned in the question.
Hence, on substituting the value $x = 0$ in the expression we will obtain the two points to which we have to plot in the graph.
Now, we have to substitute the value $x = 1$ in the linear expression \[y + 4x = 1\] which is as mentioned in the question.
Hence, on substituting the value $x = 1$ in the expression we will obtain the two points to which we have to plot in the graph.
Complete step-by-step solution:
Step 1: First of all we have to substitute the different values of x and find the value of y for the different values of x and same as we can substitute the values of y to obtain the values of x as mentioned in the solution hint.
Step 2: Now, we have to substitute the value $x = - 1$ in the linear expression \[y + 4x = 1\] which is as mentioned in the question. Hence,
$
\Rightarrow y + 4( - 1) = 1 \\
\Rightarrow y = 1 + 4 \\
\Rightarrow y = 5
$
Hence, on substituting the value $x = - 1$ in the expression we will obtain the two points to which we have to plot in the graph which are as below:
$ \Rightarrow A(x,y) = ( - 1,5)$
Step 3: Now, we have to substitute the value $x = 0$ in the linear expression \[y + 4x = 1\] which is as mentioned in the question. Hence,
$
\Rightarrow y + 4(0) = 1 \\
\Rightarrow y = 1
$
Hence, on substituting the value $x = 0$ in the expression we will obtain the two points to which we have to plot in the graph which are as below:
$ \Rightarrow B(x,y) = (0,1)$
Step 4: Now, we have to substitute the value $x = 1$ in the linear expression \[y + 4x = 1\] which is as mentioned in the question. Hence,
$
\Rightarrow y + 4(1) = 1 \\
\Rightarrow y = 1 - 4 \\
\Rightarrow y = - 3
$
Hence, on substituting the value $x = 1$ in the expression we will obtain the two points to which we have to plot in the graph which are as below:
$ \Rightarrow C(x,y) = (1, - 3)$
Step 5: Now, we have to substitute the value $x = 1$ in the linear expression \[y + 4x = 1\] which is as mentioned in the question. Hence,
$
\Rightarrow y + 4(1) = 1 \\
\Rightarrow y = 1 - 4 \\
\Rightarrow y = - 3
$
Hence, on substituting the value $x = 1$ in the expression we will obtain the two points to which we have to plot in the graph which are as below:
$ \Rightarrow C(x,y) = (1, - 3)$
Step 6: Now, with the help of the points A, B and C which we have obtained in the previous steps we have to determine the line graph which is as below:
Hence, with the help of the points A, B and C we have determine the graph of the line \[y + 4x = 1\] which is as below:
Note: To obtain the points it is necessary that we have to determine the values of y for the given expression which can be determined by placing the value of x as (-1,0,1) to obtain the value of y or vice-versa.
To obtain the graph it is necessary that we have to plot the points in the quadrant as $ \pm $ x-axis and $ \pm $ y-axis.

Recently Updated Pages
Basicity of sulphurous acid and sulphuric acid are
Master Class 11 Business Studies: Engaging Questions & Answers for Success
Master Class 11 Computer Science: Engaging Questions & Answers for Success
Master Class 11 Economics: Engaging Questions & Answers for Success
Master Class 12 English: Engaging Questions & Answers for Success
Master Class 12 Social Science: Engaging Questions & Answers for Success
Trending doubts
What are gulf countries and why they are called Gulf class 8 social science CBSE
Name the states through which the Tropic of Cancer class 8 social science CBSE
What is BLO What is the full form of BLO class 8 social science CBSE
Citizens of India can vote at the age of A 18 years class 8 social science CBSE
Advantages and disadvantages of science
The pH of the gastric juices released during digestion class 8 biology CBSE