


How do you graph \[x = - 4\]
Answer
594k+ views
Hint: Here in this question, we have to plot a graph. Usually while plotting the graph, we plot x axis versus y- axis. But here in this question we have only one variable. For this variable we have to plot the graph. Hence, we get a line which is parallel to y axis.
Complete step-by-step answer:
The graph is generally plotted x- axis versus y -axis. When we have two variables then we plot a two-dimensional graph. Here in this question, we have only one variable but this also a two-dimensional graph. Here y is not mentioned. For any value of y the x value will be the same and it is constant.
Suppose if we consider the value of y as 0 then the value of x is -4.
Suppose if we consider the value of y as +1 then the value of x is -4.
Suppose if we consider the value of y as -1 then the value of x is -4.
For any value of y either it is positive terms or the negative terms the value of x will be the same.
The graph for the given equation \[x = - 4\] is as shown below.
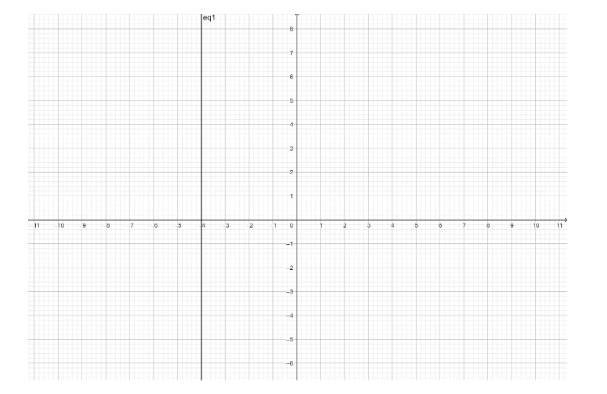
If we see the graph the line is parallel to the y-axis.
We don’t have a one dimensional graph, if the equation contains only one variable either its x or y we must know that for any value x or y the equation will be constant.
Note: The graph is plotted against the two axes namely X-axis and Y-axis. If we know the value of one, we can find the other by using the equation of the graph. This graph is two dimensional because they have mentioned only two axes.
Complete step-by-step answer:
The graph is generally plotted x- axis versus y -axis. When we have two variables then we plot a two-dimensional graph. Here in this question, we have only one variable but this also a two-dimensional graph. Here y is not mentioned. For any value of y the x value will be the same and it is constant.
Suppose if we consider the value of y as 0 then the value of x is -4.
Suppose if we consider the value of y as +1 then the value of x is -4.
Suppose if we consider the value of y as -1 then the value of x is -4.
For any value of y either it is positive terms or the negative terms the value of x will be the same.
The graph for the given equation \[x = - 4\] is as shown below.
If we see the graph the line is parallel to the y-axis.
We don’t have a one dimensional graph, if the equation contains only one variable either its x or y we must know that for any value x or y the equation will be constant.
Note: The graph is plotted against the two axes namely X-axis and Y-axis. If we know the value of one, we can find the other by using the equation of the graph. This graph is two dimensional because they have mentioned only two axes.

Recently Updated Pages
Master Class 12 Economics: Engaging Questions & Answers for Success
Master Class 12 English: Engaging Questions & Answers for Success
Master Class 12 Social Science: Engaging Questions & Answers for Success
Master Class 12 Maths: Engaging Questions & Answers for Success
Master Class 12 Physics: Engaging Questions & Answers for Success
Master Class 8 English: Engaging Questions & Answers for Success
Trending doubts
What is BLO What is the full form of BLO class 8 social science CBSE
Which Indian state shares the longest international class 8 social science CBSE
What are the 12 elements of nature class 8 chemistry CBSE
Citizens of India can vote at the age of A 18 years class 8 social science CBSE
Right to vote is a AFundamental Right BFundamental class 8 social science CBSE
Full form of STD, ISD and PCO