


How do you graph $ x + 3 = 0 $ ?
Answer
579.6k+ views
Hint: In graph to the equation of the form $ x = a $ will be straight line parallel to the y-axis passing through the point $ a $ on the x-axis use this concept and plot the graph at x=-3 for all values of y.
Complete step-by-step answer:
We are given a equation that doesn’t have all the pieces of an equation, here we are only having variable x telling
$
x + 3 = 0 \\
x = - 3 \;
$ .
So what we are going to do in this question, we are jumping on the cartesian plane.
There is one most important property of the plane which we have to remember while plotting our equation that any equation of the form $ x = a $ will be a straight line parallel to the y-axis passing through the point $ a $ on the x-axis.
So in our equation given
$
x = - 3 \\
x = ( - 3) \\
x = a \\
$
Where $ a $ is equal to $ - 3 $
Now plotting a straight line on the cartesian passing through $ a $ whose value is $ - 3 $ on x-axis which is parallel to our y-axis.
Now our graph will be like having a line $ x = - 3 $ with green colour.
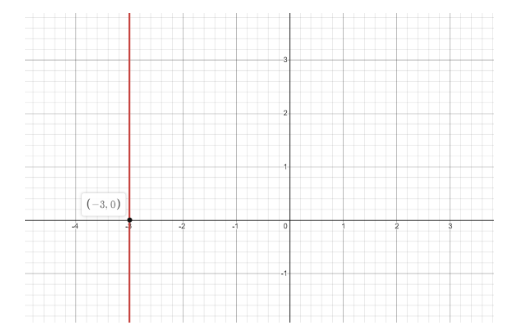
Hence we’ve successfully plotted our graph of $ x + 3 = 0 $
Note: 1. Cartesian Plane: A Cartesian Plane is given its name by the French mathematician Rene Descartes ,who first used this plane in the field of mathematics .It is defined as the two mutually perpendicular number line , the one which is horizontal is given name x-axis and the one which is vertical is known as y-axis. With the help of these axes we can plot any point on this cartesian plane with the help of an ordered pair of numbers.
2.Draw the cartesian plane only with the help of a straight ruler and pencil to get the perfect and accurate results.
Complete step-by-step answer:
We are given a equation that doesn’t have all the pieces of an equation, here we are only having variable x telling
$
x + 3 = 0 \\
x = - 3 \;
$ .
So what we are going to do in this question, we are jumping on the cartesian plane.
There is one most important property of the plane which we have to remember while plotting our equation that any equation of the form $ x = a $ will be a straight line parallel to the y-axis passing through the point $ a $ on the x-axis.
So in our equation given
$
x = - 3 \\
x = ( - 3) \\
x = a \\
$
Where $ a $ is equal to $ - 3 $
Now plotting a straight line on the cartesian passing through $ a $ whose value is $ - 3 $ on x-axis which is parallel to our y-axis.
Now our graph will be like having a line $ x = - 3 $ with green colour.
Hence we’ve successfully plotted our graph of $ x + 3 = 0 $
Note: 1. Cartesian Plane: A Cartesian Plane is given its name by the French mathematician Rene Descartes ,who first used this plane in the field of mathematics .It is defined as the two mutually perpendicular number line , the one which is horizontal is given name x-axis and the one which is vertical is known as y-axis. With the help of these axes we can plot any point on this cartesian plane with the help of an ordered pair of numbers.
2.Draw the cartesian plane only with the help of a straight ruler and pencil to get the perfect and accurate results.

Recently Updated Pages
Master Class 8 Social Science: Engaging Questions & Answers for Success
Master Class 8 Science: Engaging Questions & Answers for Success
Master Class 8 Maths: Engaging Questions & Answers for Success
Class 8 Question and Answer - Your Ultimate Solutions Guide
Master Class 9 Social Science: Engaging Questions & Answers for Success
Master Class 9 Science: Engaging Questions & Answers for Success
Trending doubts
What are gulf countries and why they are called Gulf class 8 social science CBSE
What is BLO What is the full form of BLO class 8 social science CBSE
Give full form of LPG and CNG class 8 chemistry CBSE
Citizens of India can vote at the age of A 18 years class 8 social science CBSE
Advantages and disadvantages of science
Full form of STD, ISD and PCO