


How do you graph the line $y = - x$ ?
Answer
606.3k+ views
Hint:
We know the general equation of a straight line is $y = mx + c$ where $m$ is the gradient and $y = c$ is the value where the line cuts the $y - $ axis. We know about the cartesian coordinates of points which is $(x,y)$ where $x$ is the abscissa and $y$ is the ordinate.
Complete step by step Solution:
Given that – line equation is $y = - x$
Now we will put values of $x = 0,1,2,3......$ in above equation one by one and get the value of $y$
Now we will put value $x = 0$in $y = - x$ , we get $y = 0$
Now we will put value $x = 1$ in $y = - x$ , we get $y = - 1$
Now we will put value $x = 2$ in $y = - x$ , we get $y = - 2$
Now we will put value $x = 3$ in $y = - x$ , we get $y = - 3$
Now we will put value $x = 4$ in $y = - x$ , we get $y = - 4$
We got enough points for representing a line of given linear equation $y = - x$ on the graph
Now we will put all point on the graph which we got by putting values of $x$ in equation $y = - x$ which are $(0,0),(1, - 1),(2, - 2),(3, - 3),(4, - 4)$
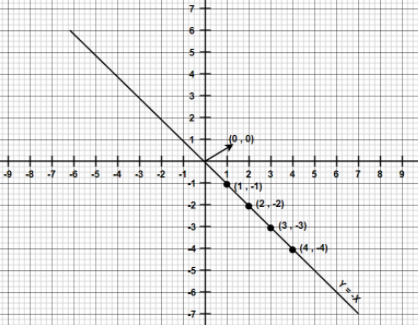
The above graph is the required graph for the given line $y = - x$
Note:
We know that general equation of line is $y = mx + c$ we can solve above given equation $y = - x$ also by comparing it with $y = mx + c$ then we will get $m = - 1$ then this means that the slope of given line is the below of $x - axis$ axis and right side of $y - axis$.
We know the general equation of a straight line is $y = mx + c$ where $m$ is the gradient and $y = c$ is the value where the line cuts the $y - $ axis. We know about the cartesian coordinates of points which is $(x,y)$ where $x$ is the abscissa and $y$ is the ordinate.
Complete step by step Solution:
Given that – line equation is $y = - x$
Now we will put values of $x = 0,1,2,3......$ in above equation one by one and get the value of $y$
Now we will put value $x = 0$in $y = - x$ , we get $y = 0$
Now we will put value $x = 1$ in $y = - x$ , we get $y = - 1$
Now we will put value $x = 2$ in $y = - x$ , we get $y = - 2$
Now we will put value $x = 3$ in $y = - x$ , we get $y = - 3$
Now we will put value $x = 4$ in $y = - x$ , we get $y = - 4$
We got enough points for representing a line of given linear equation $y = - x$ on the graph
Now we will put all point on the graph which we got by putting values of $x$ in equation $y = - x$ which are $(0,0),(1, - 1),(2, - 2),(3, - 3),(4, - 4)$
The above graph is the required graph for the given line $y = - x$
Note:
We know that general equation of line is $y = mx + c$ we can solve above given equation $y = - x$ also by comparing it with $y = mx + c$ then we will get $m = - 1$ then this means that the slope of given line is the below of $x - axis$ axis and right side of $y - axis$.
Recently Updated Pages
Basicity of sulphurous acid and sulphuric acid are
Master Class 12 Economics: Engaging Questions & Answers for Success
Master Class 12 Biology: Engaging Questions & Answers for Success
Master Class 11 English: Engaging Questions & Answers for Success
Master Class 11 Physics: Engaging Questions & Answers for Success
Master Class 11 Computer Science: Engaging Questions & Answers for Success
Trending doubts
Draw a diagram of a plant cell and label at least eight class 11 biology CBSE
Proton was discovered by A Thomson B Rutherford C Chadwick class 11 chemistry CBSE
What is the purity of pure gold in carat class 11 chemistry CBSE
Can anyone list 10 advantages and disadvantages of friction
Lysosomes are known as suicidal bags of cell why class 11 biology CBSE
Derive the equation of motion by the calculus method class 11 physics CBSE