




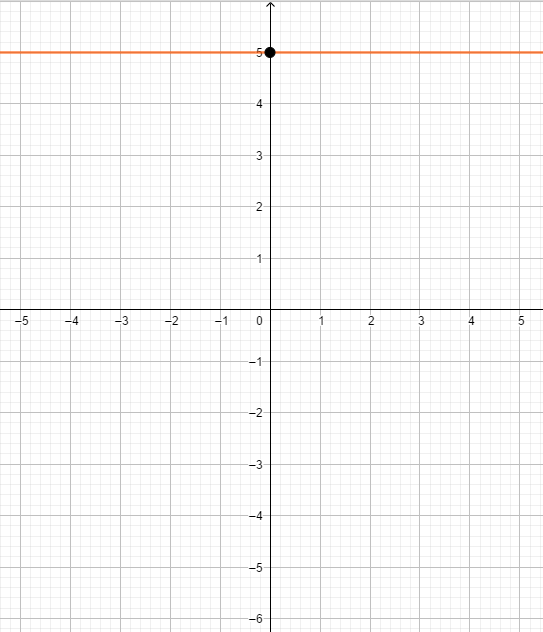
How do you graph the function $y = 5$?
Answer
 Verified
606.6k+ views
Hint: A graph is a visual diagram used to represent equations or functions or any statistical information through lines or curves. To plot a graph for an equation, we must know the coordinates of the graph. Coordinates of the graph can be found by assuming certain values for either $x$ or $y$ in the given equation and then finding out the value of another variable with the help of the first.
We must know that the function given in the question is a constant function. A constant function is a type of function whose output value is the same for every input value. It has the form of $y = c$ where $c$ is a constant. Here for $y = 5$, since whatever be the value of $x$, the value of $y$ will be $5$ only.
Complete Step by Step Solution:
The given equation for which the graph shall be plotted is $y = 5$. Since whatever be the value of $x$, the value of $y$ will only be $5$. Therefore the coordinates of the graph for $y = 5$ will be in the form of $(x,5)$ where $x$ can assume any value.
Hence, the graph will be a horizontal line passing through the $y$-axis which will be at a distance of $5$ units from the origin $(0,0)$. The coordinates of the point at which the graph will intersect the $y$-axis are $(0,4)$as the value of $x$ coordinates on the $y$-axis are $0$.
With the help of all the information, we can plot the required graph as given below:
Note:
It is fascinating to know that the graph of both the $x$-axis and $y$-axis can also be defined. The graph of $y$-axis is expressed as $x = 0$ whereas the graph of $x$-axis is expressed as $y = 0$.
We must know that the function given in the question is a constant function. A constant function is a type of function whose output value is the same for every input value. It has the form of $y = c$ where $c$ is a constant. Here for $y = 5$, since whatever be the value of $x$, the value of $y$ will be $5$ only.
Complete Step by Step Solution:
The given equation for which the graph shall be plotted is $y = 5$. Since whatever be the value of $x$, the value of $y$ will only be $5$. Therefore the coordinates of the graph for $y = 5$ will be in the form of $(x,5)$ where $x$ can assume any value.
Hence, the graph will be a horizontal line passing through the $y$-axis which will be at a distance of $5$ units from the origin $(0,0)$. The coordinates of the point at which the graph will intersect the $y$-axis are $(0,4)$as the value of $x$ coordinates on the $y$-axis are $0$.
With the help of all the information, we can plot the required graph as given below:
Note:
It is fascinating to know that the graph of both the $x$-axis and $y$-axis can also be defined. The graph of $y$-axis is expressed as $x = 0$ whereas the graph of $x$-axis is expressed as $y = 0$.
Recently Updated Pages
Master Class 11 English: Engaging Questions & Answers for Success

Master Class 11 Physics: Engaging Questions & Answers for Success
Master Class 11 Computer Science: Engaging Questions & Answers for Success
Master Class 11 Chemistry: Engaging Questions & Answers for Success
Master Class 11 Social Science: Engaging Questions & Answers for Success
Master Class 11 Accountancy: Engaging Questions & Answers for Success
Trending doubts
Draw a diagram of a plant cell and label at least eight class 11 biology CBSE
Proton was discovered by A Thomson B Rutherford C Chadwick class 11 chemistry CBSE
What is the purity of pure gold in carat class 11 chemistry CBSE
Can anyone list 10 advantages and disadvantages of friction
Lysosomes are known as suicidal bags of cell why class 11 biology CBSE
Derive the equation of motion by the calculus method class 11 physics CBSE