


How do you graph the function \[y = - 2\] ?
Answer
585.6k+ views
Hint:We need to draw the graph ‘x’ versus ‘y’. We give the random values for ‘x’ and we find the value of ‘y’. We can give all real numbers for the value of ‘x’. Thus we will have coordinate points (x, y). Hence, we can plot the graph by using the values. We can also draw the graph using the intercept method. Here we will have a line parallel to x-axis.
Complete step by step answer:
Given \[y = - 2\].Here we don’t have an ‘x’ variable in the given equation.So ‘y’ will always equal to \[ - 2\], no matter what value we put in for ‘x’, the ‘y’ is always going to be \[ - 2\].That is,
Let’s draw the graph for these coordinates,
We can see in the graph that we have a straight horizontal line that crosses the y axis at \[ - 2\].
Note:If we have \[x = - 2\] we will have a straight vertical line that crosses the x axis at \[ - 2\]. That is we have a line parallel to the y axis. One curve is for positive ‘x’ values and the other curve is for negative ‘x’ values. A graph shows the relation between two variable quantities, it contains two axes perpendicular to each other namely the x-axis and the y-axis. Each variable is measured along one of the axes. In the question, we are given one linear equation containing two variables namely x and y, x is measured along the x-axis and y is measured along the y-axis while tracing the given equations.
Complete step by step answer:
Given \[y = - 2\].Here we don’t have an ‘x’ variable in the given equation.So ‘y’ will always equal to \[ - 2\], no matter what value we put in for ‘x’, the ‘y’ is always going to be \[ - 2\].That is,
| \[x\] | \[1\] | \[ - 1\] | \[2\] | \[ - 2\] | \[3\] | \[ - 3\] | \[4\] | \[ - 4\] |
| \[y\] | \[ - 2\] | \[ - 2\] | \[ - 2\] | \[ - 2\] | \[ - 2\] | \[ - 2\] | \[ - 2\] | \[ - 2\] |
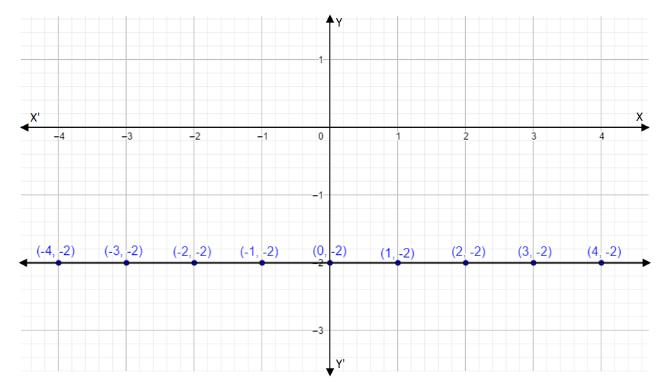
Let’s draw the graph for these coordinates,
We can see in the graph that we have a straight horizontal line that crosses the y axis at \[ - 2\].
Note:If we have \[x = - 2\] we will have a straight vertical line that crosses the x axis at \[ - 2\]. That is we have a line parallel to the y axis. One curve is for positive ‘x’ values and the other curve is for negative ‘x’ values. A graph shows the relation between two variable quantities, it contains two axes perpendicular to each other namely the x-axis and the y-axis. Each variable is measured along one of the axes. In the question, we are given one linear equation containing two variables namely x and y, x is measured along the x-axis and y is measured along the y-axis while tracing the given equations.

Recently Updated Pages
Master Class 11 English: Engaging Questions & Answers for Success
Master Class 11 Social Science: Engaging Questions & Answers for Success
Master Class 11 Maths: Engaging Questions & Answers for Success
Master Class 11 Biology: Engaging Questions & Answers for Success
Master Class 11 Physics: Engaging Questions & Answers for Success
Master Class 11 Chemistry: Engaging Questions & Answers for Success
Trending doubts