


How do you graph the equation $y = x - 6?$
Answer
570.6k+ views
Hint: First find some points from which the given line is passing by putting random values of the independent variable (x) in the given equation, so that you will get the value of the dependent variable (y). Do not take larger random values, go for values like $0,\;1,\;2,$ etc. And when plotting the graph, take the scale in between $1\;{\text{to}}\;5$, don’t take large scales.
Complete step by step solution:
In order to graph the equation $y = x - 6$, firstly we have to find some values of $x\;{\text{and}}\;y$, we will put some values of $x$ in the equation and then get respective values of $y$
For this we will create a table in which we will write the values of $x,\;y$ and the coordinates of points we will get, creating the table below.
Now, you can see in the table, how we have calculated the value of $y$ by putting random values of $x$ in the above equation. Now, we have the three co-ordinates of the required graph, i.e.$(0,\; - 6),\;(1,\; - 5),\;( - 1,\; - 7)\;{\text{and}}\;(2,\; - 4)$. So, we will now plot these three points on the graph as follows
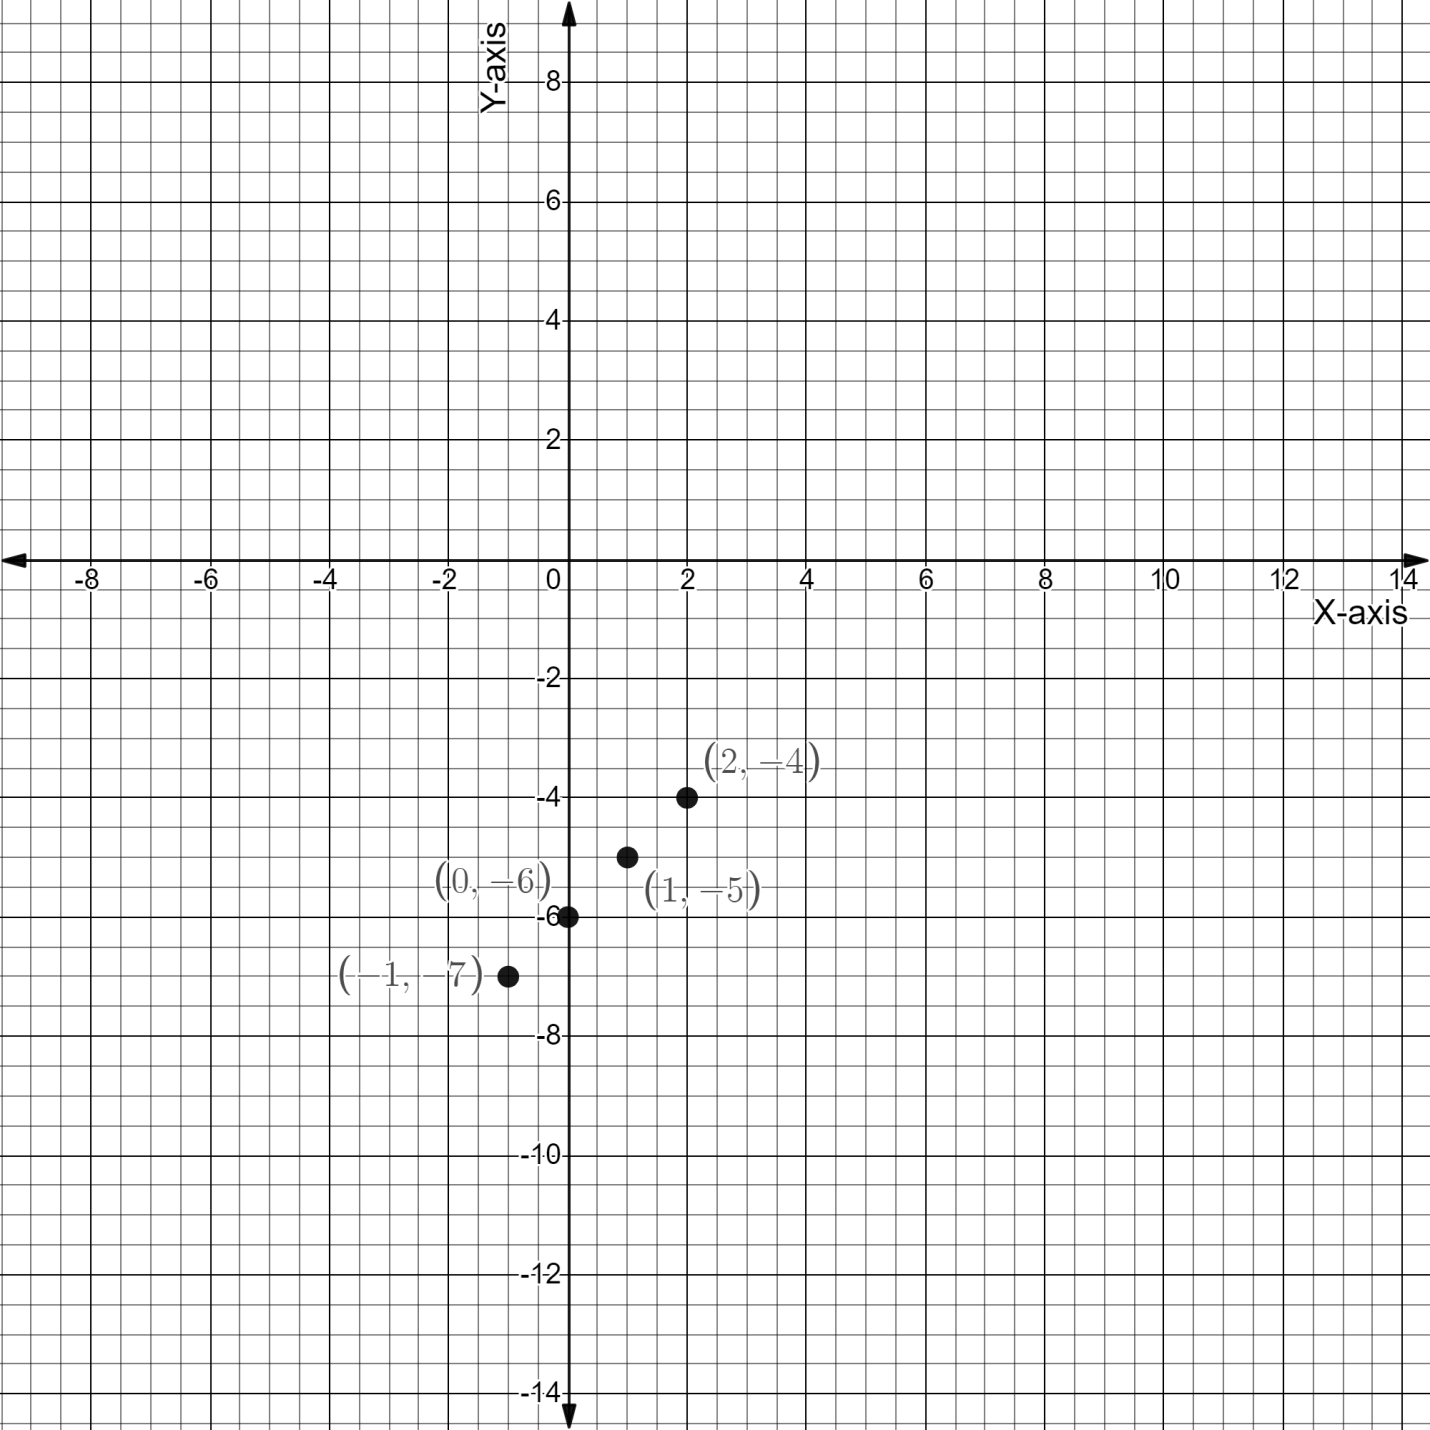
So, we have plotted all the points on the graph, now we have to draw a line passing through these points to get the required graph of the equation,
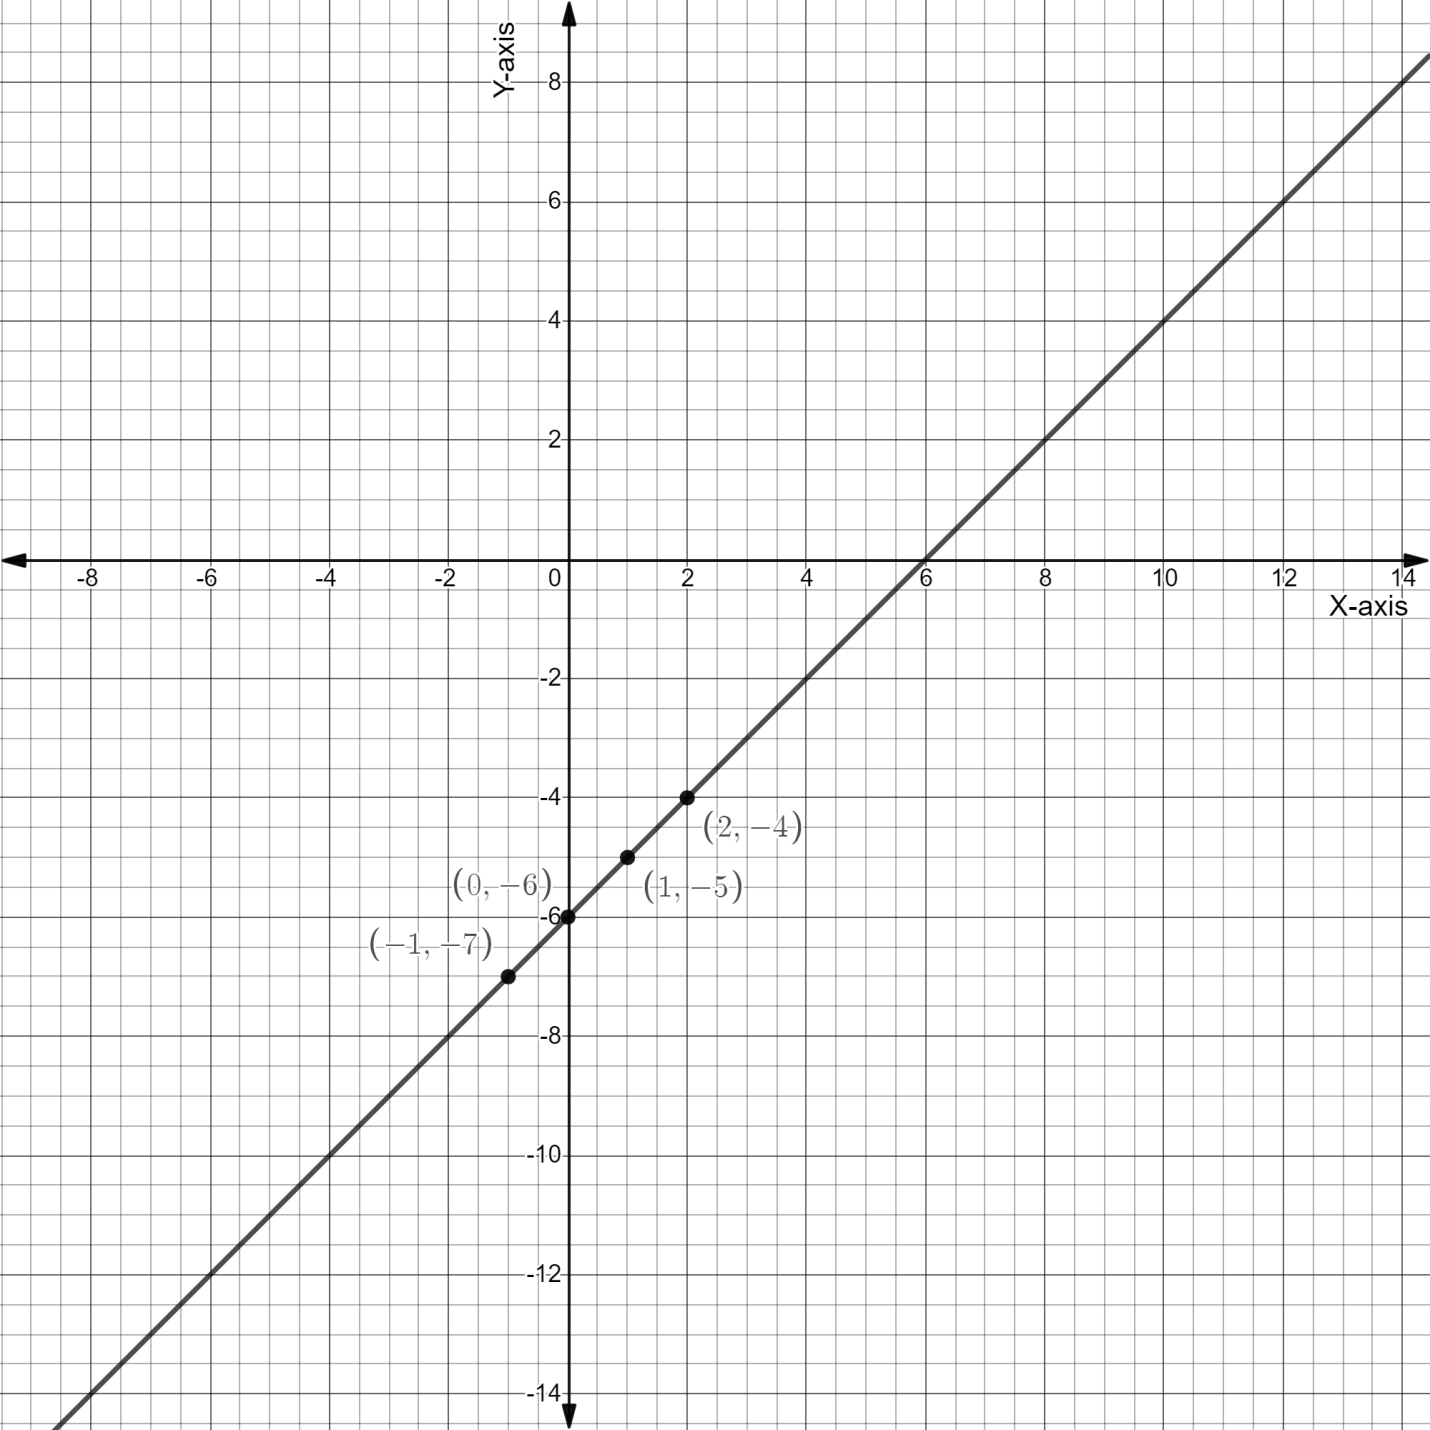
This is the required graph for the equation $y = x - 6$
Note: When plotting the graph, plot it keeping the scale of the graph in mind what you have taken the value of major unit, minor unit, because even a small scale error will make your graph incorrect. And if you are marking points on the graph then necessarily write their coordinates.
Complete step by step solution:
In order to graph the equation $y = x - 6$, firstly we have to find some values of $x\;{\text{and}}\;y$, we will put some values of $x$ in the equation and then get respective values of $y$
For this we will create a table in which we will write the values of $x,\;y$ and the coordinates of points we will get, creating the table below.
| Random values of $x$ | Value of $y = x - 6$ | Coordinates(x, y) |
| $0$ | $y = 0 - 6 = - 6$ | $(0,\; - 6)$ |
| $1$ | $y = 1 - 6 = - 5$ | $(1,\; - 5)$ |
| $ - 1$ | $y = - 1 - 6 = - 7$ | $( - 1,\; - 7)$ |
| $2$ | $y = 2 - 6 = - 4$ | $(2,\; - 6)$ |
Now, you can see in the table, how we have calculated the value of $y$ by putting random values of $x$ in the above equation. Now, we have the three co-ordinates of the required graph, i.e.$(0,\; - 6),\;(1,\; - 5),\;( - 1,\; - 7)\;{\text{and}}\;(2,\; - 4)$. So, we will now plot these three points on the graph as follows
So, we have plotted all the points on the graph, now we have to draw a line passing through these points to get the required graph of the equation,
This is the required graph for the equation $y = x - 6$
Note: When plotting the graph, plot it keeping the scale of the graph in mind what you have taken the value of major unit, minor unit, because even a small scale error will make your graph incorrect. And if you are marking points on the graph then necessarily write their coordinates.
Recently Updated Pages
Master Class 12 Business Studies: Engaging Questions & Answers for Success
Master Class 12 Biology: Engaging Questions & Answers for Success
Master Class 12 Chemistry: Engaging Questions & Answers for Success
Class 12 Question and Answer - Your Ultimate Solutions Guide
Master Class 11 Social Science: Engaging Questions & Answers for Success
Master Class 11 English: Engaging Questions & Answers for Success
Trending doubts
Find the sum of series 1 + 2 + 3 + 4 + 5 + + 100 class 9 maths CBSE
Fill the blanks with the suitable prepositions 1 The class 9 english CBSE
Difference Between Plant Cell and Animal Cell
How many hours before the closure of election must class 9 social science CBSE
What is pollution? How many types of pollution? Define it
Name 10 Living and Non living things class 9 biology CBSE