


How do you graph the equation $ x+5=0 $ ?
Answer
578.1k+ views
Hint: We have given an equation of a line as $ x+5=0 $ , which is a straight-line equation. This is the linear equation in one variable as there is the only variable that is ‘x’. To draw the graph of the equation, we need to find the value of x and for that value we will draw a vertical line that passes through that point.
Complete step-by-step answer:
We have equation of line,
$ x+5=0 $
Subtracting 5 from both the sides of the given equation, we obtained
$ x+5-5=0-5 $
Simplifying the numbers in the above equation, we obtained
$ x=-5 $
To draw a graph of a line we need two coordinates i.e. x-coordinate and the y-coordinate.
Here we don’t have ‘y’ in the equation therefore the coordinate of y i.e. y-coordinate is equals to zero.
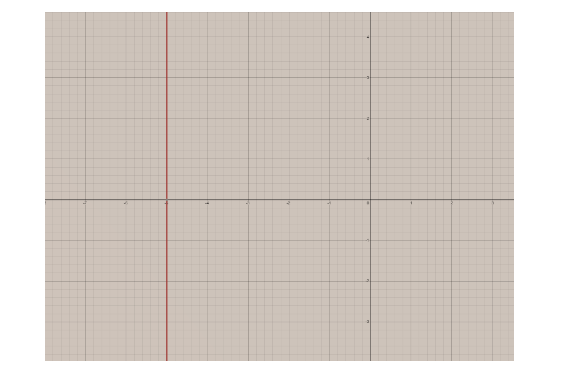
In the graph there will be a vertical line along the x-axis that passes through the x-axis at a point (x, y) = (-5, 0) or we can say at x = -5.
Thus, the graph of the equation x + 5 = 0 is as follows;
Note: We have given the linear equation in variable. If you will get the question of how to draw the graph of linear equations in two variables. This type of linear equation is sometimes called a slope-intercept form because we can easily find the slope and the intercept of the corresponding lines. This also allows us to graph it. We can quickly tell the slope i.e. $ m $ , the y-intercepts i.e., $ (y,0) $ and the x-intercept i.e., $ (0,y) $ .we can graph the corresponding line.
Complete step-by-step answer:
We have equation of line,
$ x+5=0 $
Subtracting 5 from both the sides of the given equation, we obtained
$ x+5-5=0-5 $
Simplifying the numbers in the above equation, we obtained
$ x=-5 $
To draw a graph of a line we need two coordinates i.e. x-coordinate and the y-coordinate.
Here we don’t have ‘y’ in the equation therefore the coordinate of y i.e. y-coordinate is equals to zero.
In the graph there will be a vertical line along the x-axis that passes through the x-axis at a point (x, y) = (-5, 0) or we can say at x = -5.
Thus, the graph of the equation x + 5 = 0 is as follows;
Note: We have given the linear equation in variable. If you will get the question of how to draw the graph of linear equations in two variables. This type of linear equation is sometimes called a slope-intercept form because we can easily find the slope and the intercept of the corresponding lines. This also allows us to graph it. We can quickly tell the slope i.e. $ m $ , the y-intercepts i.e., $ (y,0) $ and the x-intercept i.e., $ (0,y) $ .we can graph the corresponding line.

Recently Updated Pages
Master Class 11 English: Engaging Questions & Answers for Success
Master Class 11 Social Science: Engaging Questions & Answers for Success
Master Class 11 Maths: Engaging Questions & Answers for Success
Master Class 11 Biology: Engaging Questions & Answers for Success
Master Class 11 Physics: Engaging Questions & Answers for Success
Master Class 11 Chemistry: Engaging Questions & Answers for Success
Trending doubts
What is BLO What is the full form of BLO class 8 social science CBSE
Which Indian state shares the longest international class 8 social science CBSE
Citizens of India can vote at the age of A 18 years class 8 social science CBSE
In Indian rupees 1 trillion is equal to how many c class 8 maths CBSE
What is persistence of vision
Full form of STD, ISD and PCO