


How do you graph \[r=-3?\]
Answer
548.1k+ views
Hint: Here, we have to plot the graph with the help of a given expression.
The expression is nothing but a polar equations or co-ordinate for graph and it can be written as, \[\left( r,\,\,\theta \right)\]where, \['r'\] is the distance from the centre of coordinate and \['\theta '\] is the angle which the coordinate made.
For plotting the graph of polar equation we have to substitute the suitable and correct combination of components for \[\left( r,\theta \right):\left( -r,-\theta \right)\]for \[\theta =\dfrac{\pi }{2}\] symmetry; \[\left( r,-\theta \right)\]for polar axis symmetry; \[\left( -r,\theta \right)\]for symmetry with respect to the pole.
When the resulting answer or equation is equivalent in one or more than one test, then the graph will produce the expected symmetry.
Complete Step by Step solution:
Given that, there is an expression from which we have to draw the graph.
The given expression is a coordinate of polar equation i.e. \[\left( r,\theta \right)\]
The given expression is as follows:-
\[r=-3\]
So, from above it is clear that the value of \[r\] is given in the numerical so we have to just find the angles of it.
But the angles \[\left( \theta \right)\] for the graph we already know.
So form a table which will show the angle \[\left( \theta \right)\] and distance \[\left( r \right)\] of the polar equation.
The angles for which we have to draw the graph at a distance of \[-3\] is.
The graphical representation for the given value is as follows-
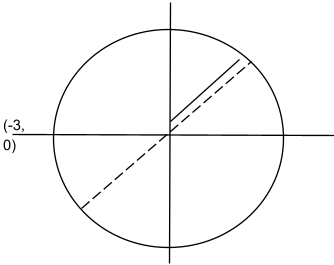
In this way the graph is plotted for a given polar coordinate value.
Note:
In this question, an expression is given from which we have to plot the graph.
But the given expression is a value of polar coordinate. That is, the coordinates of polar are \[\left( r,\,\,\theta \right)\], So the value of \['r'\] is given in the question. We just have to find out the angles\[\left( \theta \right)\].
But as we know that, there are some basic angles for a circle of graphs and from which we can draw the circle.
Whereas a polar equation is used to describe a curve on the polar grid.
The graph on the polar equation can be drawn on the three types of symmetry as ,
(1) A graph is symmetric with respect to the line \[\theta =\dfrac{\pi }{y}\] (y-axis) if it replace \[\left( r,\,\,\theta \right)\] with \[\left( -r,\,-\theta \right)\]on an equivalent equation.
(2) A graph is symmetric with respect to the polar axis (x-axis) it is replaces \[(r,\,\theta )\]with \[\left( r,\,-\theta \right)\]or \[\left( -r,\,\pi \,-\theta \right)\].
(3) A graph is symmetric with respect to the pole (origin) if it replaces \[\left( r,\theta \right)\] with \[\left( -r,\,\theta \right)\] on an equivalent equation.
The expression is nothing but a polar equations or co-ordinate for graph and it can be written as, \[\left( r,\,\,\theta \right)\]where, \['r'\] is the distance from the centre of coordinate and \['\theta '\] is the angle which the coordinate made.
For plotting the graph of polar equation we have to substitute the suitable and correct combination of components for \[\left( r,\theta \right):\left( -r,-\theta \right)\]for \[\theta =\dfrac{\pi }{2}\] symmetry; \[\left( r,-\theta \right)\]for polar axis symmetry; \[\left( -r,\theta \right)\]for symmetry with respect to the pole.
When the resulting answer or equation is equivalent in one or more than one test, then the graph will produce the expected symmetry.
Complete Step by Step solution:
Given that, there is an expression from which we have to draw the graph.
The given expression is a coordinate of polar equation i.e. \[\left( r,\theta \right)\]
The given expression is as follows:-
\[r=-3\]
So, from above it is clear that the value of \[r\] is given in the numerical so we have to just find the angles of it.
But the angles \[\left( \theta \right)\] for the graph we already know.
So form a table which will show the angle \[\left( \theta \right)\] and distance \[\left( r \right)\] of the polar equation.
The angles for which we have to draw the graph at a distance of \[-3\] is.
The graphical representation for the given value is as follows-
In this way the graph is plotted for a given polar coordinate value.
Note:
In this question, an expression is given from which we have to plot the graph.
But the given expression is a value of polar coordinate. That is, the coordinates of polar are \[\left( r,\,\,\theta \right)\], So the value of \['r'\] is given in the question. We just have to find out the angles\[\left( \theta \right)\].
But as we know that, there are some basic angles for a circle of graphs and from which we can draw the circle.
Whereas a polar equation is used to describe a curve on the polar grid.
The graph on the polar equation can be drawn on the three types of symmetry as ,
(1) A graph is symmetric with respect to the line \[\theta =\dfrac{\pi }{y}\] (y-axis) if it replace \[\left( r,\,\,\theta \right)\] with \[\left( -r,\,-\theta \right)\]on an equivalent equation.
(2) A graph is symmetric with respect to the polar axis (x-axis) it is replaces \[(r,\,\theta )\]with \[\left( r,\,-\theta \right)\]or \[\left( -r,\,\pi \,-\theta \right)\].
(3) A graph is symmetric with respect to the pole (origin) if it replaces \[\left( r,\theta \right)\] with \[\left( -r,\,\theta \right)\] on an equivalent equation.
Recently Updated Pages
Master Class 12 Economics: Engaging Questions & Answers for Success
Master Class 12 Physics: Engaging Questions & Answers for Success
Master Class 12 English: Engaging Questions & Answers for Success
Master Class 12 Social Science: Engaging Questions & Answers for Success
Master Class 12 Maths: Engaging Questions & Answers for Success
Master Class 12 Business Studies: Engaging Questions & Answers for Success
Trending doubts
Which are the Top 10 Largest Countries of the World?
What are the major means of transport Explain each class 12 social science CBSE
Draw a labelled sketch of the human eye class 12 physics CBSE
Why cannot DNA pass through cell membranes class 12 biology CBSE
Differentiate between insitu conservation and exsitu class 12 biology CBSE
Draw a neat and well labeled diagram of TS of ovary class 12 biology CBSE