


How do you graph $f\left( x \right)=2+\ln x$?
Answer
606.9k+ views
Hint: In this question we will first understand how the graph of $f(x)={{e}^{x}}$ works and the asymptote of the graph and then we will understand how to graph of $f(x)=\ln x$ works and then we will deduce what happens when a constant value is added to the function and then plot the graph for the same.
Complete step-by-step solution:
We have the given logarithmic function as $f\left( x \right)=2+\ln x$ .
To understand how the graph of this function flows, we will first look at the graph of the exponential function which is denoted as $f(x)={{e}^{x}}$.
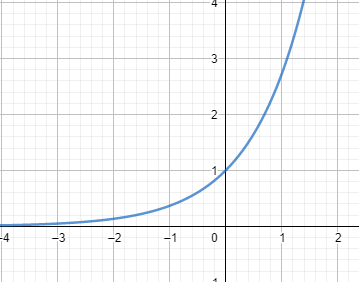
It can be seen from the graph that has a horizontal asymptote which is at $y=0$ and it passes through the point $(0,1)$ on the graph.
Now consider the graph of the logarithmic function, it is the inverse of the graph of the exponential function and it is denoted as $f(x)=\ln x$
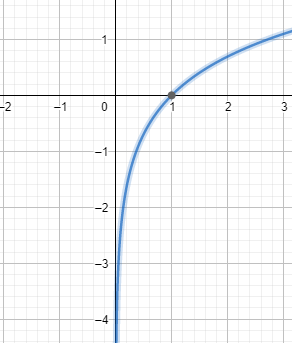
From the graph we can see that the function has a vertical asymptote which is it $x=0$ and it passes through the point $(1,0)$ on the graph.
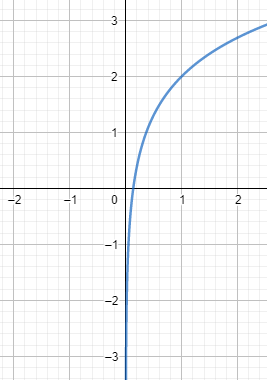
Therefore, from the above graph we can deduce that the graph of $f\left( x \right)=2+\ln x$ will be vertically shifted or vertically transformed of the line $\ln x$ which is shifted by $2$. It will have the asymptote at $x=0$ and will pass through the point which is $2$ units shifted in the $y$ axis, which can be written as $(1,0+2)$ which can be simplified as $(1,2)$.
On plotting the graph, we get:
Which is the required solution.
Note: An asymptote is a line on the graph through which the graph passes to and reaches either positive or negative infinity.
Logarithm is used to simplify a mathematical expression, it converts multiplication to addition, division to subtraction and exponents to multiplication.
The most commonly used bases in logarithm are $10$ and $e$ which has a value of approximate $2.713....$
Complete step-by-step solution:
We have the given logarithmic function as $f\left( x \right)=2+\ln x$ .
To understand how the graph of this function flows, we will first look at the graph of the exponential function which is denoted as $f(x)={{e}^{x}}$.
It can be seen from the graph that has a horizontal asymptote which is at $y=0$ and it passes through the point $(0,1)$ on the graph.
Now consider the graph of the logarithmic function, it is the inverse of the graph of the exponential function and it is denoted as $f(x)=\ln x$
From the graph we can see that the function has a vertical asymptote which is it $x=0$ and it passes through the point $(1,0)$ on the graph.
Therefore, from the above graph we can deduce that the graph of $f\left( x \right)=2+\ln x$ will be vertically shifted or vertically transformed of the line $\ln x$ which is shifted by $2$. It will have the asymptote at $x=0$ and will pass through the point which is $2$ units shifted in the $y$ axis, which can be written as $(1,0+2)$ which can be simplified as $(1,2)$.
On plotting the graph, we get:
Which is the required solution.
Note: An asymptote is a line on the graph through which the graph passes to and reaches either positive or negative infinity.
Logarithm is used to simplify a mathematical expression, it converts multiplication to addition, division to subtraction and exponents to multiplication.
The most commonly used bases in logarithm are $10$ and $e$ which has a value of approximate $2.713....$
Recently Updated Pages
Basicity of sulphurous acid and sulphuric acid are
Master Class 12 Economics: Engaging Questions & Answers for Success
Master Class 12 Biology: Engaging Questions & Answers for Success
Master Class 11 English: Engaging Questions & Answers for Success
Master Class 11 Physics: Engaging Questions & Answers for Success
Master Class 11 Computer Science: Engaging Questions & Answers for Success
Trending doubts
Draw a labelled sketch of the human eye class 12 physics CBSE
Why is the cell called the structural and functional class 12 biology CBSE
Draw ray diagrams each showing i myopic eye and ii class 12 physics CBSE
Which are the Top 10 Largest Countries of the World?
Differentiate between homogeneous and heterogeneous class 12 chemistry CBSE
Which is the correct genotypic ratio of mendel dihybrid class 12 biology CBSE