


How do you graph \[9y \leqslant 12x\]?
Answer
545.7k+ views
Hint: Here in this question, we have to plot graph. In this question we have two variable and we have greater than and less than inequality. Initially we have to solve the inequality for y variable later give x values as 0,1,2,3… simultaneously we get the y values on simplification. Using the x and y value construct the graph and later Shade above the line for a "greater than" (y> or y\[ \geqslant \]) or below the line for a "less than" (y< or y\[ \leqslant \]).
Complete step-by-step answer:
Given, \[9y \leqslant 12x\] -------(1)
Now solve the equation for y
Divide equation (1) both side by 9, then
\[ \Rightarrow \dfrac{9}{9}y \leqslant \dfrac{{12}}{9}x\]
On simplification, we get
\[ \Rightarrow y \leqslant \dfrac{{12}}{9}x\]
Divide both and numerator by 3 on right hand side equality
\[ \Rightarrow y \leqslant \dfrac{4}{3}x\]
Now, find the x and y value by giving the x values as 0, 1, 2, 3, … to the equation \[y = \dfrac{4}{3}x\], simultaneously we get the values of y
Put x=0
\[ \Rightarrow y = \dfrac{4}{3}\left( 0 \right)\]
\[\therefore y = 0\]
Therefore, co-ordinate \[\left( {x,y} \right) = \left( {0,0} \right)\]
Put x=1
\[ \Rightarrow y = \dfrac{4}{3}\left( 1 \right)\]
\[\therefore y = \dfrac{4}{3}\]
Therefore, co-ordinate \[\left( {x,y} \right) = \left( {1,\dfrac{4}{3}} \right)\]
Put x=2
\[ \Rightarrow y = \dfrac{4}{3}\left( 2 \right)\]
\[\therefore y = \dfrac{8}{3}\]
Therefore, co-ordinate \[\left( {x,y} \right) = \left( {2,\dfrac{8}{3}} \right)\]
Put x=3
\[ \Rightarrow y = \dfrac{4}{3}\left( 3 \right)\]
\[\therefore y = 4\]
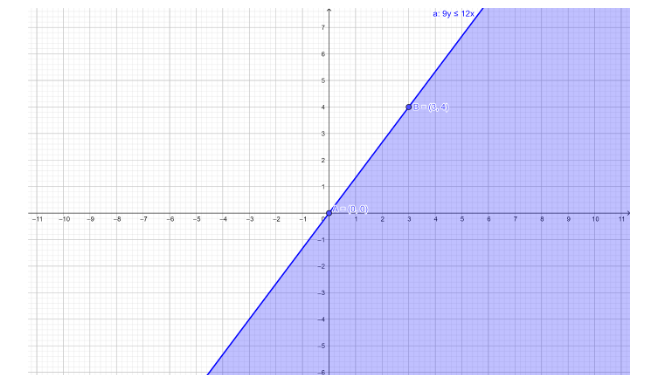
Therefore, co-ordinate \[\left( {x,y} \right) = \left( {3,4} \right)\]
The line passes through the two points \[\left( {0,0} \right)\] and \[\left( {3,4} \right)\], and any line is completely determined by two of its points.
Now, the graph of the given inequality \[9y \leqslant 12x\] by using the above coordinate points and the inequality is \[ \leqslant \] then we have to Shade below the line in graph
-
Note: The graph is plotted x-axis versus y axis. The graph is two dimensional. By the equation of a graph, we can plot the graph by assuming the value of x. we can’t assume the value of y. because the value of y depends on the value of x. Hence, we have plotted the graph.
Complete step-by-step answer:
Given, \[9y \leqslant 12x\] -------(1)
Now solve the equation for y
Divide equation (1) both side by 9, then
\[ \Rightarrow \dfrac{9}{9}y \leqslant \dfrac{{12}}{9}x\]
On simplification, we get
\[ \Rightarrow y \leqslant \dfrac{{12}}{9}x\]
Divide both and numerator by 3 on right hand side equality
\[ \Rightarrow y \leqslant \dfrac{4}{3}x\]
Now, find the x and y value by giving the x values as 0, 1, 2, 3, … to the equation \[y = \dfrac{4}{3}x\], simultaneously we get the values of y
Put x=0
\[ \Rightarrow y = \dfrac{4}{3}\left( 0 \right)\]
\[\therefore y = 0\]
Therefore, co-ordinate \[\left( {x,y} \right) = \left( {0,0} \right)\]
Put x=1
\[ \Rightarrow y = \dfrac{4}{3}\left( 1 \right)\]
\[\therefore y = \dfrac{4}{3}\]
Therefore, co-ordinate \[\left( {x,y} \right) = \left( {1,\dfrac{4}{3}} \right)\]
Put x=2
\[ \Rightarrow y = \dfrac{4}{3}\left( 2 \right)\]
\[\therefore y = \dfrac{8}{3}\]
Therefore, co-ordinate \[\left( {x,y} \right) = \left( {2,\dfrac{8}{3}} \right)\]
Put x=3
\[ \Rightarrow y = \dfrac{4}{3}\left( 3 \right)\]
\[\therefore y = 4\]
Therefore, co-ordinate \[\left( {x,y} \right) = \left( {3,4} \right)\]
The line passes through the two points \[\left( {0,0} \right)\] and \[\left( {3,4} \right)\], and any line is completely determined by two of its points.
Now, the graph of the given inequality \[9y \leqslant 12x\] by using the above coordinate points and the inequality is \[ \leqslant \] then we have to Shade below the line in graph
-
Note: The graph is plotted x-axis versus y axis. The graph is two dimensional. By the equation of a graph, we can plot the graph by assuming the value of x. we can’t assume the value of y. because the value of y depends on the value of x. Hence, we have plotted the graph.

Recently Updated Pages
Master Class 11 English: Engaging Questions & Answers for Success
Master Class 11 Maths: Engaging Questions & Answers for Success
Master Class 11 Biology: Engaging Questions & Answers for Success
Master Class 11 Social Science: Engaging Questions & Answers for Success
Master Class 11 Physics: Engaging Questions & Answers for Success
Master Class 11 Accountancy: Engaging Questions & Answers for Success
Trending doubts
Convert 40circ C to Fahrenheit A 104circ F B 107circ class 8 maths CBSE
When people say No pun intended what does that mea class 8 english CBSE
What are the methods of reducing friction. Explain
Write a short biography of Dr APJ Abdul Kalam under class 8 english CBSE
Explain the role of the opposition party in a demo class 8 social studies CBSE
Why did James Mill and Thomas Macaulay think that European class 8 social science CBSE