


Graph $y = - \dfrac{1}{3}x.$
Answer
557.4k+ views
Hint: For plotting a graph we need different x values as well as their corresponding y values.
Such that to solve this question we need to find the x intercept, y intercept and some intermediate values. Also the x-intercept and y-intercept can be found by substituting y=0 and x=0 respectively.
After finding these values we just need to plot them on the XY plane.
Complete step-by-step answer:
Given
$y = - \dfrac{1}{3}x......................\left( i \right)$
For the above given expression we have to plot a graph.
Now we need to find the x intercept, y intercept and some intermediate values for plotting the graph.
X intercept is the point where the graph touches X axis such that y=0, such that substituting y=0 in (i):
\[
\Rightarrow y = - \dfrac{1}{3}x. \\
\Rightarrow 0 = - \dfrac{1}{3}x. \\
\Rightarrow - \dfrac{1}{3}x = 0 \\
\Rightarrow x = 0.................\left( {ii} \right) \;
\]
\[\therefore {\text{x intercept}} = \left( {0,0} \right)\]
Now we need to find y intercept:
Since \[{\text{x intercept}} = \left( {0,0} \right)\]
Y intercept is the point where the graph touches the Y axis, i.e. x=0.
\[\therefore {\text{y intercept}} = \left( {0,0} \right)\]
Now let’s find some intermediate points:
For x=3:
$
\Rightarrow y = - \dfrac{1}{3}x \\
\Rightarrow y = - \dfrac{1}{3} \times 3 \\
\Rightarrow y = - 1 \;
$
$\therefore \left( {3,\; - 1} \right)\;{\text{is}}\;{\text{a}}\;{\text{point}}{\text{.}}$
For x=-3
\[
\Rightarrow y = - \dfrac{1}{3}x \\
\Rightarrow y = - \dfrac{1}{3} \times - 3 \\
\Rightarrow y = 1 \;
\]
\[\therefore \left( { - 3,\;1} \right)\;{\text{is}}\;{\text{a}}\;{\text{point}}{\text{.}}\]
For x=6
\[
\Rightarrow y = - \dfrac{1}{3}x \\
\Rightarrow y = - \dfrac{1}{3} \times 6 \\
\Rightarrow y = - 2 \;
\]
\[\therefore \left( {6,\; - 2} \right)\;{\text{is}}\;{\text{a}}\;{\text{point}}{\text{.}}\]
Now all these values which we have got from above is to be plotted in a XY plane.
Plotting the points
\[\left( {0,0} \right),\left( {3, - 1} \right),\left( { - 3,1} \right),\left( {6, - 2} \right)\].
On plotting the above points we get the following graph:
Note: While approaching similar graphical questions one should find as many points as possible from the given conditions and common knowledge. Also one must be careful while doing the solution. Also while plotting the graph one must choose appropriate scale considering the values that should be plotted.
Such that to solve this question we need to find the x intercept, y intercept and some intermediate values. Also the x-intercept and y-intercept can be found by substituting y=0 and x=0 respectively.
After finding these values we just need to plot them on the XY plane.
Complete step-by-step answer:
Given
$y = - \dfrac{1}{3}x......................\left( i \right)$
For the above given expression we have to plot a graph.
Now we need to find the x intercept, y intercept and some intermediate values for plotting the graph.
X intercept is the point where the graph touches X axis such that y=0, such that substituting y=0 in (i):
\[
\Rightarrow y = - \dfrac{1}{3}x. \\
\Rightarrow 0 = - \dfrac{1}{3}x. \\
\Rightarrow - \dfrac{1}{3}x = 0 \\
\Rightarrow x = 0.................\left( {ii} \right) \;
\]
\[\therefore {\text{x intercept}} = \left( {0,0} \right)\]
Now we need to find y intercept:
Since \[{\text{x intercept}} = \left( {0,0} \right)\]
Y intercept is the point where the graph touches the Y axis, i.e. x=0.
\[\therefore {\text{y intercept}} = \left( {0,0} \right)\]
Now let’s find some intermediate points:
For x=3:
$
\Rightarrow y = - \dfrac{1}{3}x \\
\Rightarrow y = - \dfrac{1}{3} \times 3 \\
\Rightarrow y = - 1 \;
$
$\therefore \left( {3,\; - 1} \right)\;{\text{is}}\;{\text{a}}\;{\text{point}}{\text{.}}$
For x=-3
\[
\Rightarrow y = - \dfrac{1}{3}x \\
\Rightarrow y = - \dfrac{1}{3} \times - 3 \\
\Rightarrow y = 1 \;
\]
\[\therefore \left( { - 3,\;1} \right)\;{\text{is}}\;{\text{a}}\;{\text{point}}{\text{.}}\]
For x=6
\[
\Rightarrow y = - \dfrac{1}{3}x \\
\Rightarrow y = - \dfrac{1}{3} \times 6 \\
\Rightarrow y = - 2 \;
\]
\[\therefore \left( {6,\; - 2} \right)\;{\text{is}}\;{\text{a}}\;{\text{point}}{\text{.}}\]
Now all these values which we have got from above is to be plotted in a XY plane.
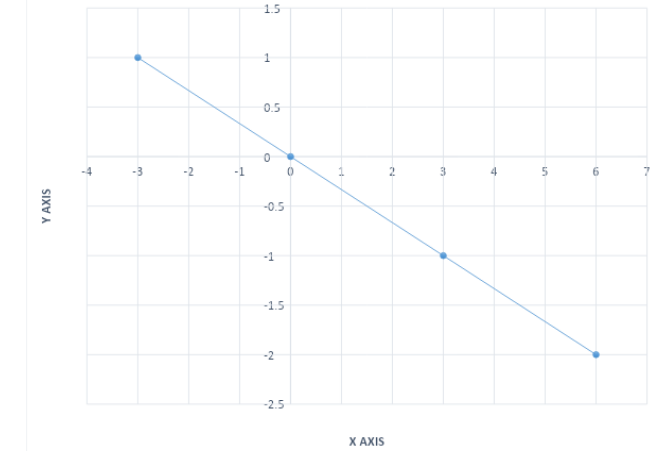
Plotting the points
\[\left( {0,0} \right),\left( {3, - 1} \right),\left( { - 3,1} \right),\left( {6, - 2} \right)\].
| X | Y |
| 0 | 0 |
| 3 | -1 |
| -3 | 1 |
| 6 | -2 |
On plotting the above points we get the following graph:
Note: While approaching similar graphical questions one should find as many points as possible from the given conditions and common knowledge. Also one must be careful while doing the solution. Also while plotting the graph one must choose appropriate scale considering the values that should be plotted.
Recently Updated Pages
Master Class 8 Social Science: Engaging Questions & Answers for Success
Master Class 8 English: Engaging Questions & Answers for Success
Class 8 Question and Answer - Your Ultimate Solutions Guide
Master Class 8 Maths: Engaging Questions & Answers for Success
Master Class 8 Science: Engaging Questions & Answers for Success
Master Class 7 English: Engaging Questions & Answers for Success
Trending doubts
Convert 40circ C to Fahrenheit A 104circ F B 107circ class 8 maths CBSE
What are the 12 elements of nature class 8 chemistry CBSE
What is the difference between rai and mustard see class 8 biology CBSE
When people say No pun intended what does that mea class 8 english CBSE
Write a letter to the Municipal Commissioner to inform class 8 english CBSE
Explain the role of the opposition party in a demo class 8 social studies CBSE