


How do you graph using the intercepts for \[2x+y=13\] ?
Answer
551.4k+ views
Hint: In order to graph plot for the equation, \[2x+y=13\] , we need the points to be plotted in the graph, however here, we need to draw using the intercepts , for this, we can find the two intercepts , \[x-\] and \[y-\] intercepts by putting \[x\] and \[y\] zero one by one and then simply plotting the intercepts.
Complete step-by-step answer:
Firstly let us write the equation, for which we need to plot the graph
\[2x+y=13\]
Let us find the \[x-\] and \[y-\] intercepts
Now, to find the \[x-\] intercept, put \[y=0\] in the equation
i.e.
\[
2x+y=13 \\
\Rightarrow 2x+0=13 \\
\Rightarrow 2x=13 \\
\Rightarrow x=\dfrac{13}{2} \;
\]
Therefore, the \[x-\] intercept is \[\dfrac{13}{2}\]
Now, let us find the \[y-\] intercept
For this, let us put \[x=0\] in the equation
\[
2x+y=13 \\
\Rightarrow 2\left( 0 \right)+y=13 \\
\Rightarrow y=13 \;
\]
Thus, we get the \[y-\] intercept, which is \[13\]
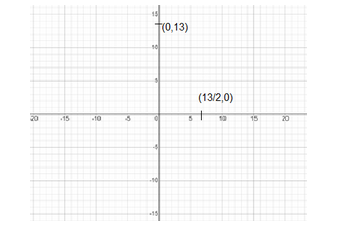
Therefore, we get the intercept points as
\[\left( \dfrac{13}{2},0 \right)\] and \[\left( 0,13 \right)\]
Now, if we plot these two points in the graph, we get
Now, this equation is for a straight line graph for which the intercepts have been drawn
If we join the two points, we get the graph as required
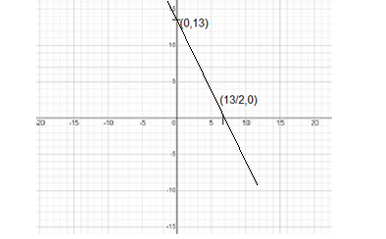
Hence, the graph is plotted.
Note: The formula used for the graph is for finding the intercepts. For finding \[x-\] intercept, first put \[y=0\] in the equation and in order to find the \[y-\] intercept, put \[x=0\] , in this way the two points for the graph are found and then plotted to get a straight line graph.
Complete step-by-step answer:
Firstly let us write the equation, for which we need to plot the graph
\[2x+y=13\]
Let us find the \[x-\] and \[y-\] intercepts
Now, to find the \[x-\] intercept, put \[y=0\] in the equation
i.e.
\[
2x+y=13 \\
\Rightarrow 2x+0=13 \\
\Rightarrow 2x=13 \\
\Rightarrow x=\dfrac{13}{2} \;
\]
Therefore, the \[x-\] intercept is \[\dfrac{13}{2}\]
Now, let us find the \[y-\] intercept
For this, let us put \[x=0\] in the equation
\[
2x+y=13 \\
\Rightarrow 2\left( 0 \right)+y=13 \\
\Rightarrow y=13 \;
\]
Thus, we get the \[y-\] intercept, which is \[13\]
Therefore, we get the intercept points as
\[\left( \dfrac{13}{2},0 \right)\] and \[\left( 0,13 \right)\]
Now, if we plot these two points in the graph, we get
Now, this equation is for a straight line graph for which the intercepts have been drawn
If we join the two points, we get the graph as required
Hence, the graph is plotted.
Note: The formula used for the graph is for finding the intercepts. For finding \[x-\] intercept, first put \[y=0\] in the equation and in order to find the \[y-\] intercept, put \[x=0\] , in this way the two points for the graph are found and then plotted to get a straight line graph.

Recently Updated Pages
Basicity of sulphurous acid and sulphuric acid are
Master Class 11 Business Studies: Engaging Questions & Answers for Success
Master Class 11 Computer Science: Engaging Questions & Answers for Success
Master Class 11 Economics: Engaging Questions & Answers for Success
Master Class 12 English: Engaging Questions & Answers for Success
Master Class 12 Social Science: Engaging Questions & Answers for Success
Trending doubts
What are gulf countries and why they are called Gulf class 8 social science CBSE
Name the states through which the Tropic of Cancer class 8 social science CBSE
What is BLO What is the full form of BLO class 8 social science CBSE
What are the 12 elements of nature class 8 chemistry CBSE
In Indian rupees 1 trillion is equal to how many c class 8 maths CBSE
Citizens of India can vote at the age of A 18 years class 8 social science CBSE