


How do you graph the line $y = x - 4$ by plotting points?
Answer
544.8k+ views
Hint: A graph of a function f is the set of ordered pairs; the equation of the graph is generally represented as $y = f\left( x \right)$, where x and f(x) are real numbers. We substitute the value of x and we determine the value of y and then we mark the points in the graph and we join the points. So, we will first form a table of the points that lie on the given line and then plot those points and the line passing through them.
Complete step-by-step answer:
Here in this question, we have to plot the graph for the given function. A graph of a function is set of ordered pairs and it is represented as $y = f\left( x \right)$, where x and f(x) are real numbers. These pairs are in the form of Cartesian form and the graph is the two-dimensional graph.
First, we have to find the value of y by using the graph equation $y = x - 4$. Let us substitute the value of x as $0$, $4$, and $2$.
Now we consider the value of x as $0$, the value of y is
$ \Rightarrow y = 0 - 4$
$ \Rightarrow y = - 4$
Now we consider the value of x as $4$, the value of y is
$ \Rightarrow y = 4 - 4$
$ \Rightarrow y = 0$
Now we consider the value of x as $2$, the value of y is
$ \Rightarrow y = 2 - 4$
$ \Rightarrow y = - 2$
Now we draw a table for these values we have
The graph plotted for these point is represented below:
Note: There are infinitely many points that satisfy the equation of a given line. The graph is plotted in x-axis versus y axis. By the equation of a graph, we can plot the graph by assuming the value of x. The points may vary from person to person, but the graph of the straight line remains the same.
Complete step-by-step answer:
Here in this question, we have to plot the graph for the given function. A graph of a function is set of ordered pairs and it is represented as $y = f\left( x \right)$, where x and f(x) are real numbers. These pairs are in the form of Cartesian form and the graph is the two-dimensional graph.
First, we have to find the value of y by using the graph equation $y = x - 4$. Let us substitute the value of x as $0$, $4$, and $2$.
Now we consider the value of x as $0$, the value of y is
$ \Rightarrow y = 0 - 4$
$ \Rightarrow y = - 4$
Now we consider the value of x as $4$, the value of y is
$ \Rightarrow y = 4 - 4$
$ \Rightarrow y = 0$
Now we consider the value of x as $2$, the value of y is
$ \Rightarrow y = 2 - 4$
$ \Rightarrow y = - 2$
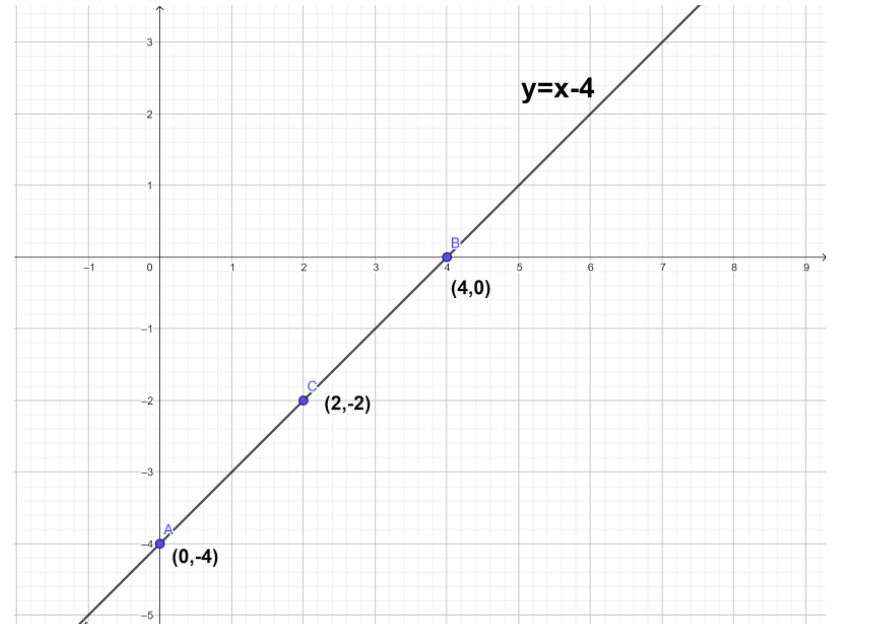
Now we draw a table for these values we have
| x | $0$ | $4$ | $2$ |
| y | $ - 4$ | $0$ | $ - 2$ |
The graph plotted for these point is represented below:
Note: There are infinitely many points that satisfy the equation of a given line. The graph is plotted in x-axis versus y axis. By the equation of a graph, we can plot the graph by assuming the value of x. The points may vary from person to person, but the graph of the straight line remains the same.

Recently Updated Pages
Basicity of sulphurous acid and sulphuric acid are
Master Class 12 Economics: Engaging Questions & Answers for Success
Master Class 12 Biology: Engaging Questions & Answers for Success
Master Class 11 English: Engaging Questions & Answers for Success
Master Class 11 Physics: Engaging Questions & Answers for Success
Master Class 11 Computer Science: Engaging Questions & Answers for Success
Trending doubts
What is BLO What is the full form of BLO class 8 social science CBSE
One cusec is equal to how many liters class 8 maths CBSE
Citizens of India can vote at the age of A 18 years class 8 social science CBSE
Full form of STD, ISD and PCO
Give me the opposite gender of Duck class 8 english CBSE
What is roughage Give two examples class 8 biology CBSE